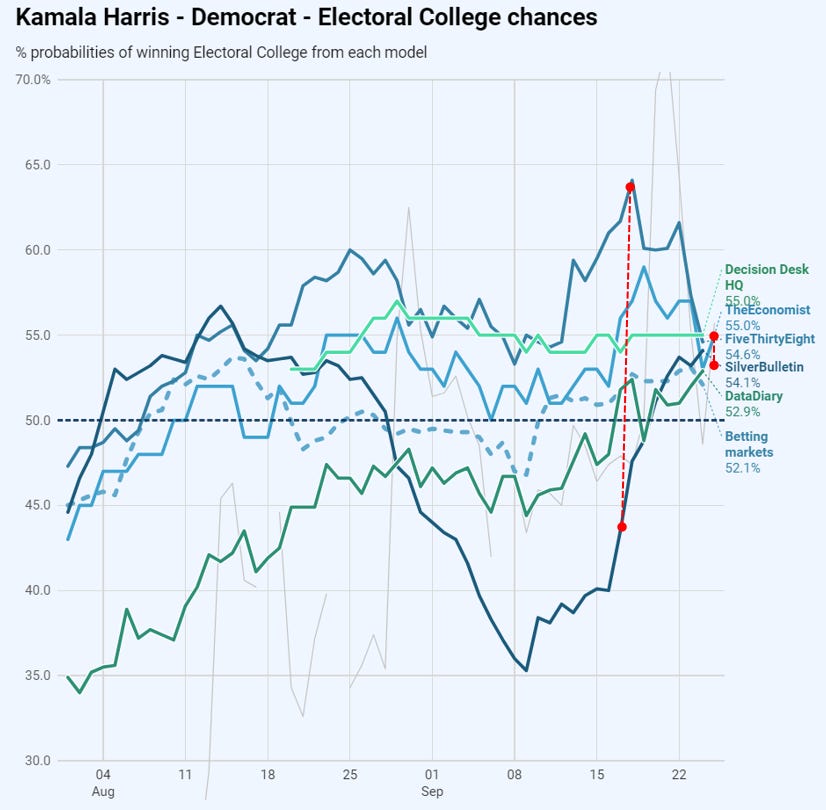
Model checking versus reality - redux
Right now there has been quite a change in dynamic amongst the models.
Only a week ago, there was a spread of a touch over 20 percentage points amongst the modelled probabilities they assigned to to Harris / Trump victories. Or, in other words, there was a lot of disagreement.
Today, that same spread is 2 percentage points. That’s absurdly tight. Everyone is within a percentage point of agreeing that Harris’ chances are 54%, Trump’s 46%.
Some of this change comes down to the disappearance of Nate Silver’s absurd convention bounce adjustment (the enormous dip from the end of August, and then the surge upwards in mid-September). It has now been mostly washed out of much of his model by the avalanche of new polling (thank god), taking his model back to the others.
But a more fundamental dynamic is that there’s been a fair amount of quite confusing polling at both the state and national level - contradictory, national polls in tension with state reads etc. The rational approach of a model under these circumstances is to maintain wide confidence intervals, which tends to push back towards the “centre” line of “no idea” = 50% for each, with Harris’ marginally better polling putting her a little above the line.
Now, imagine for a moment we are at election day today. And try to evaluate the performance of each model. Even at the state level, they are giving pretty similar reads.1 Last week there would have been a clear winner in this evaluation. This week they will all stand or fall together - it’s more or less impossible to separate them. Does that mean it is impossible to judge which did best in the interim?
Betting markets
There is one performance tracker that we can compare to - the “wisdom of crowds” read you get through betting markets. This does track over time, and we can evaluate each model by how well it predicts this movement.
Or more directly, let’s imagine that we don’t care about the result - we just want to predict the movement of the betting markets - and perhaps even want to make some money from this. Which model would make us the most?
The immediate problem is that to decide this, you have to decide on a trading strategy. The model tells us - say - that Harris has a 67% chance. The betting markets imply a 55% chance. Clearly, if you believe your model, you should be betting on Harris. But how? And how much?
The Kelly Criterion
There is an objective answer to this question, assuming you want to maximise your (log) gain over time. You should use “Kelly betting”, that is, you should bet according to the Kelly Criterion.
Roughly, this tells you that the bigger the difference between the odds you are getting and your own belief in the result (here, we are assuming your beliefs are being guided by one of these polling models). The amount you should bet is your overall “bankroll” (i.e., the amount you have available for betting) times p - (1-p)/(b-1). Where p is the probability of the result you are betting on, and b are its numerical odds - that is, the multiple of your stake you get back if your bet wins.2
And this formula gives you an objective betting strategy. Each day, look at the odds available for a candidate, what the model says about their chances, and adjust your betting until your position reflects the Kelly criterion.
Let’s say, you start with a model saying that Harris has 48% chance - as FiveThirtyEight did at the start of August). The betting markets gave 2.22 odds (that is, an implied chance of 45%. Clearly you should bet a small amount on Harris on this basis3 because you believe her odds are greater than the market is showing.
The Kelly criterion gives you the exact amount: 5.45% of your bankroll - so if you were prepared to risk £100 overall, you should bet £5.45 on this.
Then, as we go through time, and the odds and the model changes, you can increase and decrease your position for or against Harris, guided by the Kelly Criterion. Sometimes you will be selling back your position (at the betting market prices), sometimes you will be buying more of the position (again, at the betting market prices).
At the end of our time period, we sell our resulting position back to the market again, and see what we have gained or lost.
This gives us a judgement of which model is best. Or at least gives us a particular measure of which model is best at predicting betting markets over a particular time-period.
Enough talk. Which model is best?
We should first caution that your choice of time period makes a huge difference. The starting and ending time periods are the biggest contributors to the total sum (you buy and sell your entire positions then). We will choose 1 August as the starting point, and today (24 September as the end). We will also ignore all fees and spreads, and use just daily closing positions of the betting markets - using an average read (as according to RealClearPolitics’ daily average.
Obviously the variation in the actual markets means opportunity for arbitrage between the markets - so you might think acting in reality you should be able to do better than shown here (e.g., by selecting the most advantageous market available). However, the real world also introduces spreads, and trading fees - which (spoiler alert) will generally be a bigger drag on total profit than the arbitrage available. So you might not.


