When you try to calibrate a polling model, which is hard enough to begin with, the dynamics - how the model moves over time - are particularly mysterious. This is because you only have one time-point to check your results1 (all the state-level results, national Presidential results, Senate, House and Gubernatorial elections) which is on the day of the actual vote.2 And as Euclid will tell you, a single point is not a line - you need at least two.
Despite this lack of empirical data, the polling modellers have come up with a bewildering variety of ways to handle the evolution both of uncertainty, and true underlying shifts in public opinion between the current date - where they have polling - and election day.
And they’re all evidence-free. There’s only one snapshot you can test, and that’s election day.
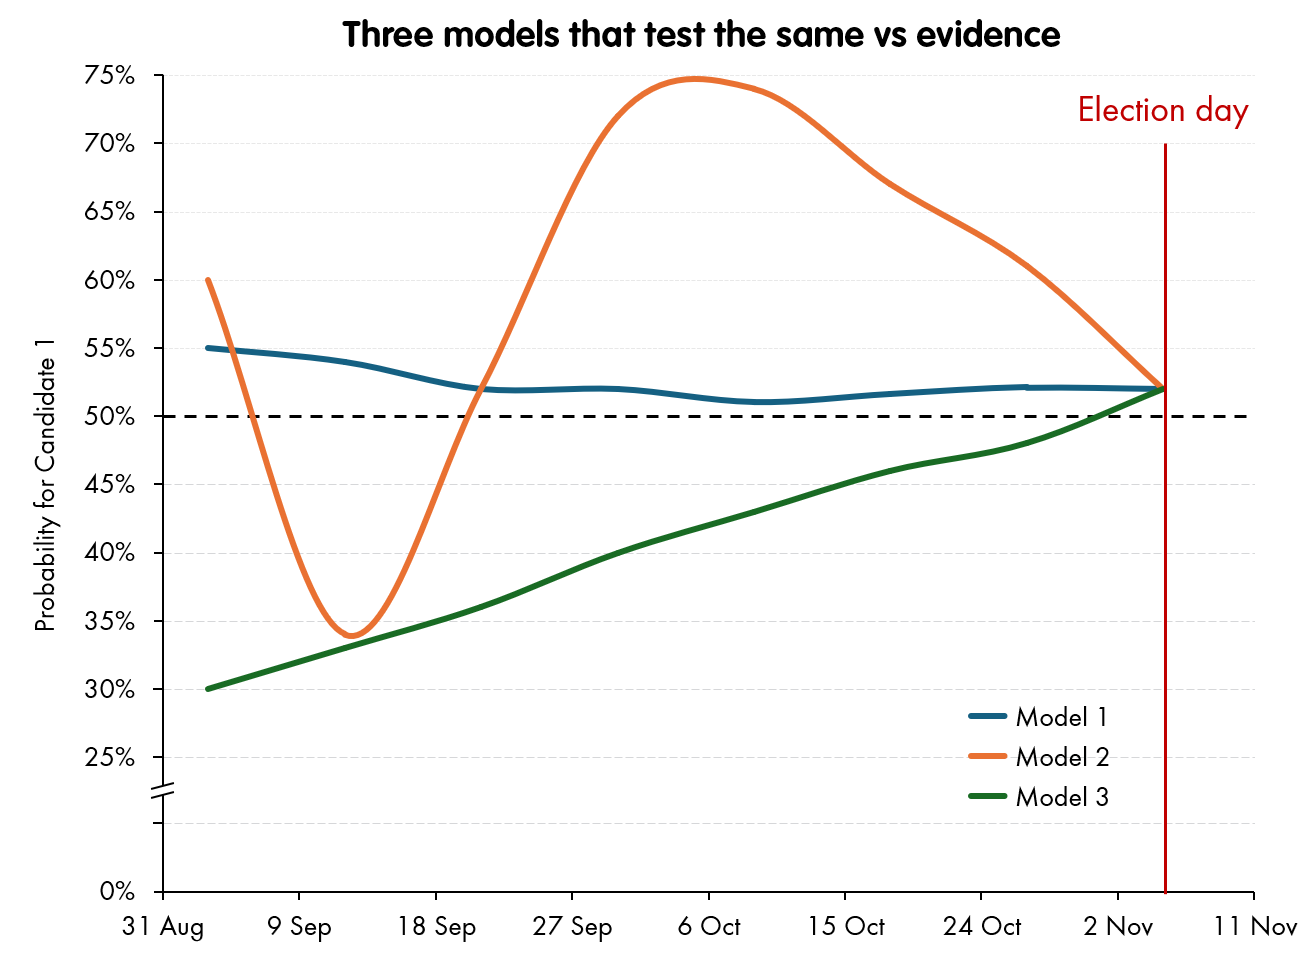
For example, these three models have distinctly different dynamics, but as long as they all end up in the same place on polling day, their calibration “goodness” scores versus the true results will be identical.
So, how do the polling modelers choose how their dynamics are going to work?
Pretty much three ways:
Consistency - the methodology should be consistent over time. That is, there is nothing “special” about polling day, other than it being the day we are trying to forecast for.
Conservatism - the read should - all other things being equal - not move too much. A stable signal is to be preferred to a “bouncy” one.
Calibration - matching the few breadcrumbs of non-election day evidence: early voting patterns, betting markets.
Consistency
The first point is the most powerful, but it really is an internal consistency check. Whatever method the model is using on polling day - which is what it is judged on - how takes its “prior” and updates it with new information from the polling; this should be the same approach as it’s using for any other day.3
Of course this information can be processed with allowances for how much time there is before election day, and therefore the amount the polls could drift before then - that’s the whole point of these adjustments to the polling averages, but in general terms, election day should get no “special treatment”. This consistency of methodology makes the empirical test supplied by the match (or not) on election day an implied test on the rest of the dynamics.
Conservatism
Conservatism is a difficult one to balance, because political races really do move. Significant events happen that really do change people’s voting intention, new information really does come in, and you want your model to react to it.
But all other things equal, you would prefer Model 1 in the chart above. It comes to its “opinion” early, and then hardly changes it all the way to polling day. Roughly, conservatism tends to be an input into a score that modelers use to judge their performance, but it will be heavily penalised by a race that actually does move - a model that does not react to last-minute information is more likely to get the final (tested) result wrong.
Calibration
Then, there are a few breadcrumbs of evidence that actually are revealed along the way to polling day (some of them, retrospectively). And you can calibrate your pre-polling dynamics against these.
For example, snapshots of interim opinion can be gleaned from early-voting numbers - though these have to be treated with extraordinary caution, simply because people who do early voting are systemically different from those who vote on election day. Disentangling the signal of changes of opinion with time from the changes of sample tested is properly hard.
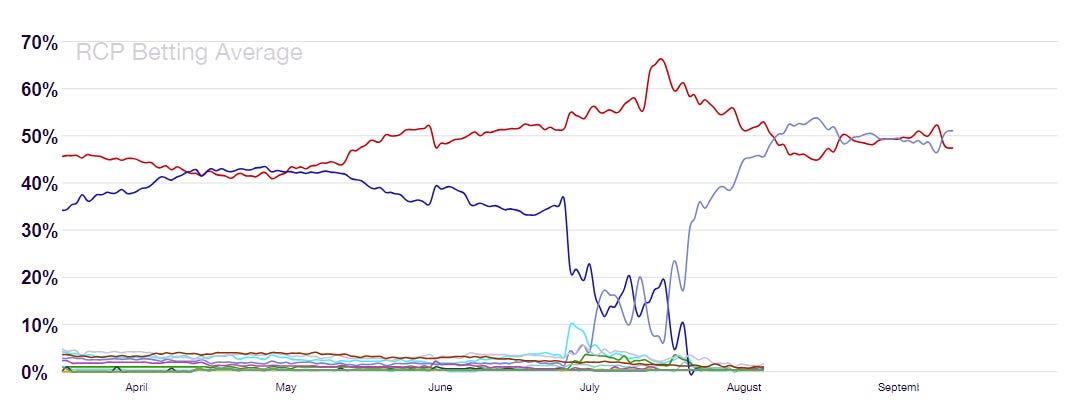
More convenient, though just as controversial, are the movement of betting markets, or other trading indicators of the result.4 Nowadays, we have insight into a wide variety of betting markets on the result, which have enough customers and liquidity to represent a decent “wisdom of crowds” view of the result. Looking at averages of markets like Betfair, Polymarket (and five others), you can see the pattern as Joe Biden stumbled and then left the stage, to be succeeded by Kamala Harris.
This gives some dynamics, which can be checked vs the movement of models.
Of course, there are huge worries here. First, the betting markets might be just wrong. The people betting are perhaps betting on the person they want to win, not the one they have any evidence actually will, or they want to make headlines by that market moving. Second, and more worryingly, the betting markets will be using the same information as the polling models, and might even be betting using the outputs of the more popular ones - so this signal could simply become self-referential.
What has been interesting in this particular race is the extent to which the models’ output have and have not moved with the betting markets.
Let’s match Kamala Harris’ chances as extracted from a broad average of the betting markets, with the various models - one by one.
(As usual, these are static images and will not update - live feeds from each of the models are available on the main page)
This gives a revealing look at the dynamics of the models. Until mid-August, the odds followed The Economist and family set of models, as well as being fairly close to The Silver Bulletin model. And then there is somewhat of a divergence, with the odds remaining somewhat less bullish for Harris than any of the models.5
Out of all of them, the odds stayed closer to Silver’s model (though, given the founder’s influence especially amongst the sports-betting set, you do wonder whether there is influence from Silver’s output to the betting markets.)
But then, by late August, as Silver’s “convention bounce” adjustments really started pushing down on Harris’ read in his model, the betting markets finally decided that they' weren’t buying what he was selling, and remained hovering around the “toss-up” line, even while Silver’s line plummeted down to 36% for Harris - the vast majority of this plunge powered by his various adjustments.
In the past, Silver has pointed to the betting markets tracking closely to his model as evidence for the quality of his methodology. Now that they have shifted off and are tracking other models much more closely (pretty much bang on The Economist for example), he has gone uncharacteristically quiet about it.
A last “C”
There is also a fourth motivation - as well as Consistency, Conservatism and Calibration, that could be considered as a motivation for designing the dynamics of a model prior to election day: Commercialism.
Very simply, a model that moves is more newsworthy than a model that - boringly - judges that the race is around 50:50 and that is not good evidence to move too far from that. A nice big swing - even one that is artificially introduced - will do nicely. Going back to my example models from before - each of which will score precisely the same in any empirical test of accuracy:
Model 1 may be preferred on the Consistency measure, but you can’t write daily stories about it. And Model 3 might have some kind of “Candidate 1 is catching up”, quality, but you can only write that story three times, max. For a Commercial operation, you want Model 2 - in orange. And - in the shape of the current market-leader - I think that’s what we’ve got.
To be clear, here we’re talking about the dynamics that are added to the models beyond their raw polling averages - e.g., to account for movement between the current date and polling day: e.g., an assumed drift towards economic fundamentals, historic reversion, or current events that are assumed to be temporary. The methodology for aggregating raw polling into a “prediction of polling” has plenty of data - it can be tested against its ability to predict the “next poll” that comes in.
The existence of all these different levels and races is why I’m not nearly as pessimistic as the attached article and paper on the ability to calibrate polling models to the results - they are multilevel models, and as well as getting hundreds of results each election cycle, you can apply them at mid-terms, to other races and non-US elections. What is more, they are not binary outcomes - there are vote numbers to use for calibration in each case.
Taking this absolutely literally (i.e., every day must be treated the same) means restricting the model to give a “nowcast” of “What would happen if the election were held today?” And while this is an option (some of old FiveThirtyEight models gave this as option), it is rarely provided nowadays. Instead, modellers generally try to go for a “what should we currently believe about the chances on election day”, which allow things like probabilistic drift in the interim time.
For example, Donald Trump’s DJT 0.00%↑ Media and Technology Group, whose own public documents acknowledges has a value much dependent on Donald Trump’s political profile, lost around 18% of its value after the 10 September debate.
There’s also the Princeton Election Consortium, which has more dramatic dynamics still. But this is for other reasons: their methodology is borked.


Interesting piece, thanks. Also reminds me of some of the Taleb/Silver arguments from a few years back (https://nautil.us/nassim-talebs-case-against-nate-silver-is-bad-math-237369/). On the calibration point, also feels like having a prediction interval would shed some light on the usefulness of models, e.g. if my current 95% interval for probability of a win is X-Y, then this uncertainty should ideally narrow over time, with my election day probability still within this range (otherwise I’ve potentially been too overconfident/reactive to news along the way).
I would have thought a reasonable polling average methodology should also be able to predict the outcome of polls, at least over short time horizons (e.g. those currently in the field but not released yet).