

Ambulance responses and handovers
Where are we right now?

There’s data that’s important to people and there’s data that’s released in a timely manner. Sadly, the Venn diagram of these two doesn’t overlap as much as you’d like it to.
This is certainly true for ambulance response time data.1 As a member of the public, what I really want to know is how long an ambulance is likely to take to get to me if I call it - say - with symptoms of a stroke, or a suspected heart attack. These are both highly time-critical conditions, where minutes and even seconds count.
This is chart of the answer over the last few months.
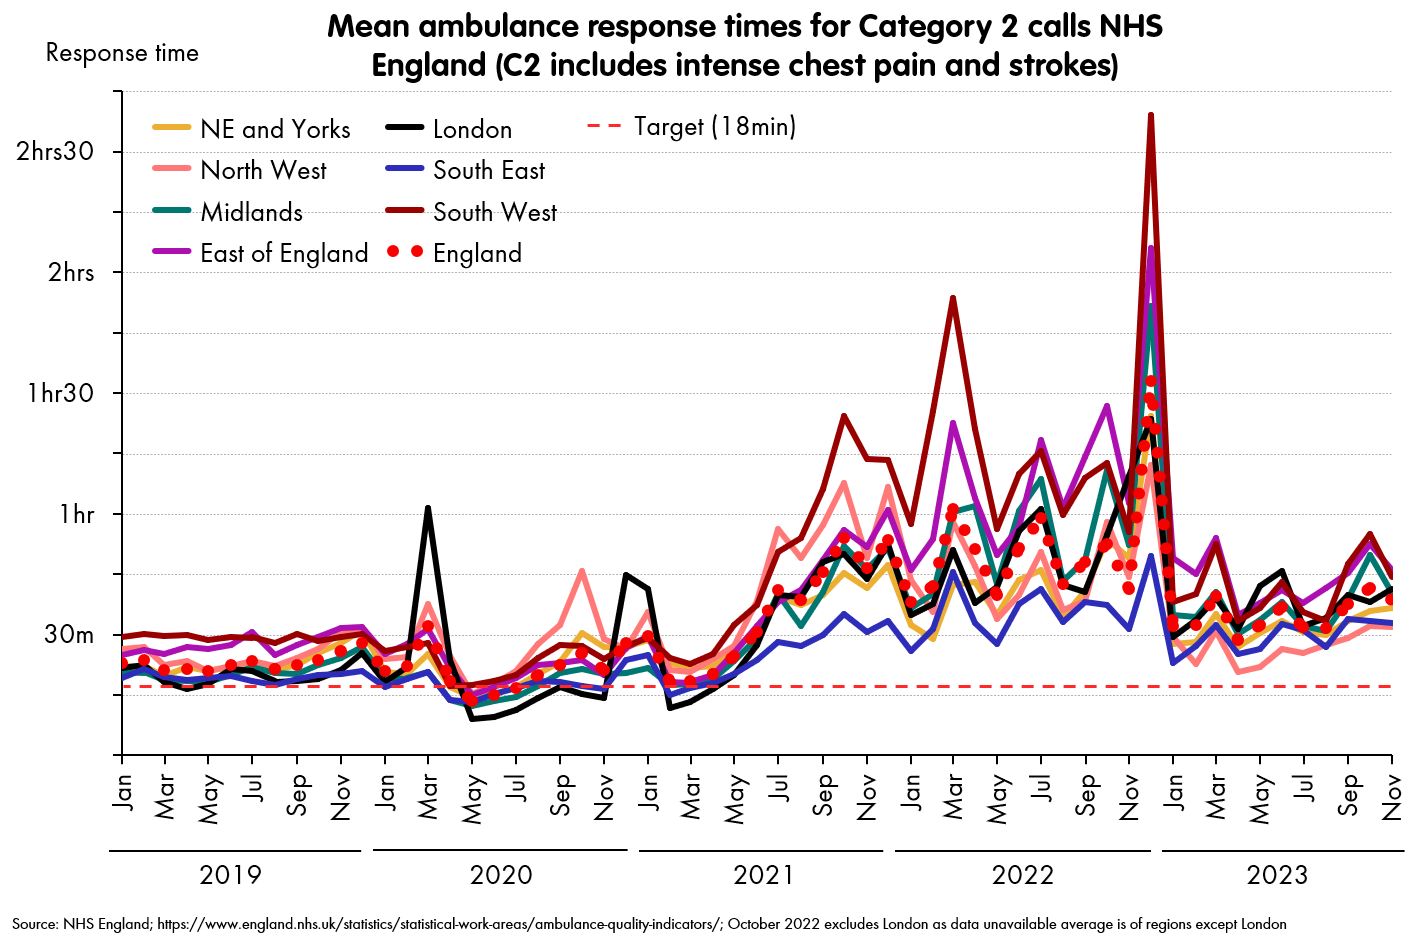
The trouble with this (apart from the obviously appalling performance), is that this data is logged monthly, and released even later - on the second Thursday after the month in question. That means - for example - that we had no idea2 how bad December 2022 had become until the middle of January 2023, when times were already three times better.
A less relevant measure - at least to patients - is ambulance handover times: the time each patient taken to a hospital spends waiting to be transferred to A&E. But the advantage here is that it comes out in a more timely manner: it’s logged a daily basis and released weekly in a manner that means that on the day of release, the most recent data point is four days ago.
It looks like this.

The obvious question: the two seem to move together, so can we use this to get the best of both worlds: derive an estimate of the important variable (response time) from the timely (handover time) variable?
You certainly should be able to, if the mechanism that I’ve been wibbling on about for months is anywhere near right. That is, that ambulance response times are dictated by the waits they are forced to make at hospitals to hand their patients over because those hospitals are too full (because you can’t move people out of A&E, because the wards are full, because etc, etc.)
In fact, the relationship should be pretty simple - roughly linear. For every ambulance spending a minute waiting to hand over, that’s a minute’s-worth of resource off the road.
So the most bone-headed thing would be to plot mean response times (we’ll choose Category 2 times) against patient handover times, and see what happens.

Huh. That … doesn’t … look … too bad. It obviously can’t be extrapolated too far (e.g., when you have handover times less than five minutes, you’re obviously not going to hit instantaneous response times), and we’ve got this by only on means over 30/31 days, which adds its own complexity, plus you can do a little better with some transformations … but sticking with a boneheadedly simple linear association is good enough to be say a few things with some confidence.
Let’s make an the assumption that the relationship between the two monthly means carries across to daily means - this is reasonable when you think about the mechanism by which handovers and response times are related.
The most recent handover times reported across England are in the region of 43 minutes (from the winter sitreps). That was last week.
So, just reading off the chart above (or doing smart things with log transforms on both axes, but honestly, it makes little difference) it seems fairly likely that national response times for Category 2s were just under an hour last week (58 minutes is the central estimate).
And doing it for an ambulance services one-by-one gives you the range for the various regions, with the South West the worst at around 91 minutes.

What can we do with this? It’s helpful in itself to get close to get real-time data, but the real value is to not be fooled by the relatively reassuring picture from the latest response data-point on October 2023, obtain an up-to-date picture of how pressured the ambulance services are in December (at least, how bad things were four days ago).
And so then you can project this basis level of strain with the other small numerical exercises - the JN.1-powered new waves of COVID, the flu starting to come in. Which tell you that it only gets worse from here - and dramatically so.
Unfortunately, this rather confirms an existing picture, and leads me to offer a couple of pieces of (informal) advice. (Note please that I’m not a medical professional, nor am I not a policy maker, and you should do what at least the first of these tell you.)
Please check whether you’re eligible for a flu jab or COVID booster, and consider whether you want to book one in: time spent now to avoid hospital in the next four weeks looks like time well spent.
If you - or a loved-one is vulnerable or otherwise likely to need emergency care in the next few weeks (say, from now until mid-January 2024), consider making a plan for getting them to medical help if an ambulance cannot be counted on to arrive in a reasonable time. Call 999/111 - do what they advise you, do what you’d usually do, but consider what your next move would be if they told you that help was upwards of an hour away.
At least in England and Wales. Scotland releases theirs weekly.
Except for anecdotes from inside A&E, a few nightmare stories from paramedics and — every so often — a leaked screenshot from a despairing dispatcher.