A lot happened in COVID between the middle of 2021 and the end of 2022, but one thing seemed fairly clear: the net direction was overall positive.
Putting numbers on it: at the start of August 2021, we were tracking at about 25,000 cases a day. And although there were huge spikes in the interim, then by the end of December 2022, it was hovering at around 5,000 - we’d seen a 5x drop. (Image straight from the incomparable coronavirus dashboard).
But they were all of them deceived
The trouble is, this is not what was really going on. The truth was the opposite.
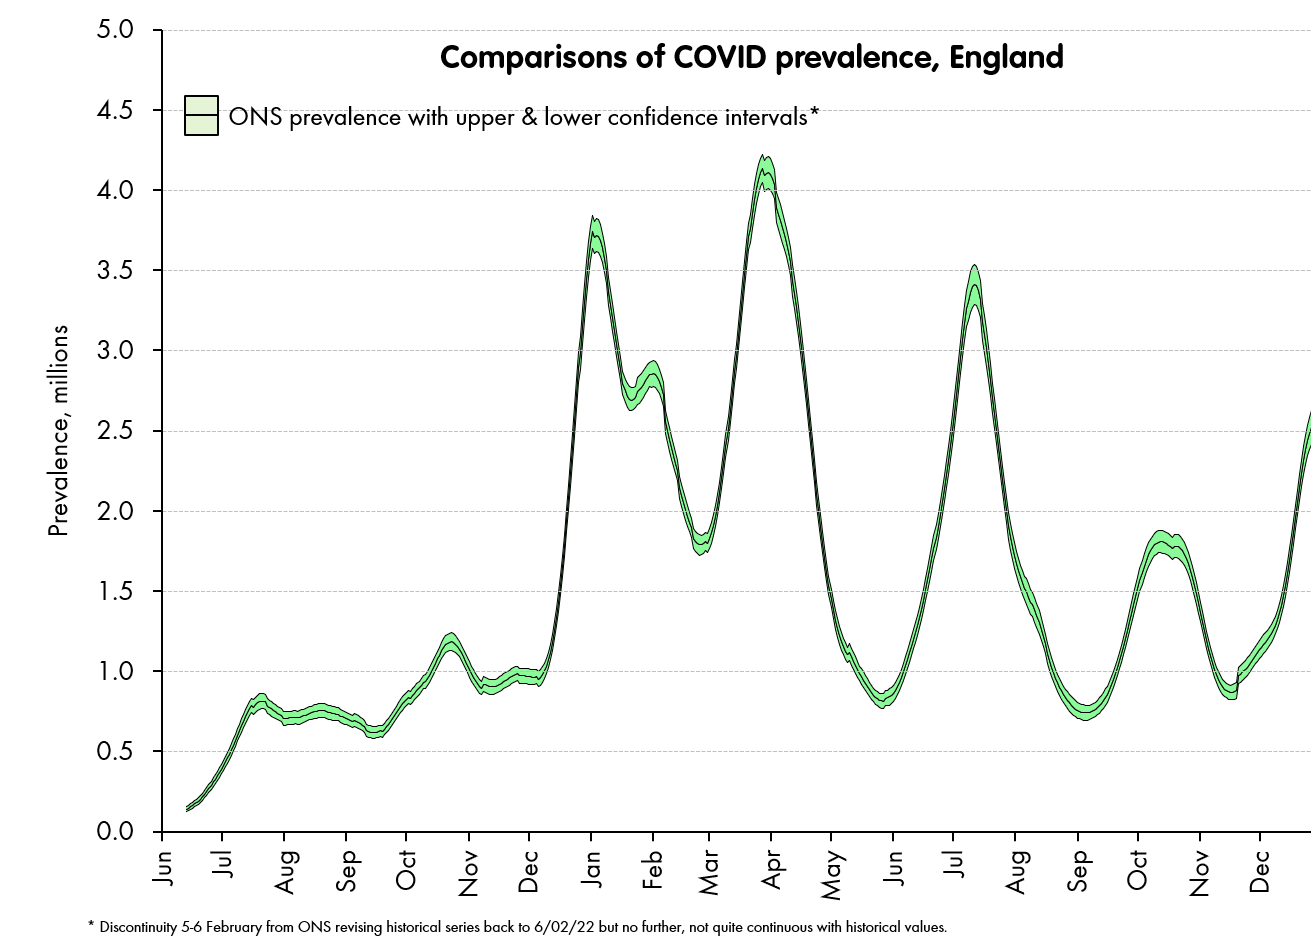
Instead, our best estimate - from the ONS’ randomised representative sample - is that COVID infections were nearly four times higher at the end of 2022 than they were in the middle of 2021.
Instead, what had happened between mid 2021 and the end of 2022 was a dramatic drop in case ascertainment: the share of infections that led to a positive, reported test: a “case”.
That is, we had quietly transitioned from a situation in 2021-early 2022 where COVID testing across England was picking up more than 50% of infections, to a situation from mid-late 2022 where it was picking up less than 5% - a more-than ten-fold drop in ascertainment.
We can be pretty sure of this, because the invaluable ONS infection survey was running throughout, and they randomly tested a representative sample of the population each and every week, giving a clear estimate of infection prevalence. We can use this as “ground truth” and compare it to the number of positive tests returned and catalogued by UKHSA.1
This dramatic ascertainment drop-off came for two reasons: first, the advent of Omicron, which infected many more people, but manifested more mildly - at least in vaccinated or previously infected people - so was less likely to drive people to test. But second, and probably more important, there were a series of rule changes, most obviously some major rule changes in the first half 2022 (no more free LFTs, no more rules about testing before going to mass events or travelling). As a result, each “detected” case should be thought of as representing something very different to what it did before.
At the start of the 2022, an objective observer could reasonably assume that one case detected should imply there were ~two infections in the community. But at the end of the year, one case detected implied more like twenty infections - despite the lower case numbers, the infections were in fact far higher.2
Won’t get fooled again
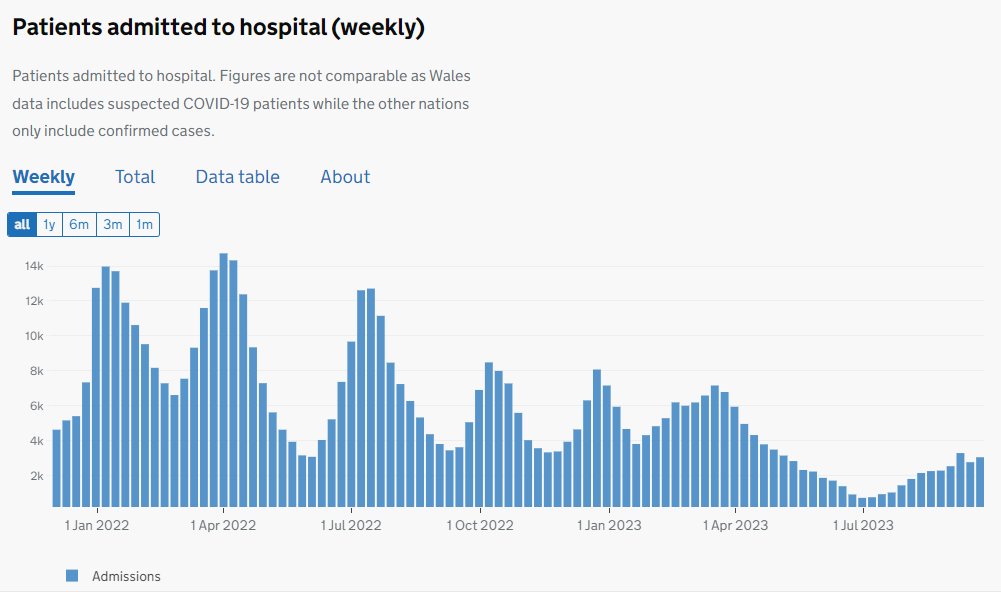
More recently than this - from 2022 into 2023 - we have seen another apparently encouraging trend. Hospital admissions have followed a similar bumpy path, but overall, they have declined. In a very similar way to our optimist from the previous year, we can point out that our admissions are currently (Q3 2023) around a quarter of what they were at the start of 2022.
So, there’s an obvious question - is this one true?
Our objective observer might point to the fact that - similarly to cases, then over this period, the rules for testing in hospitals have also been enormously relaxed. Rather than every admission being tested in a blanket policy, testing is now only done for some kind of clinical need (clinicians need to know if this person has COVID in order treat them properly) or for infection control (we really could do without COVID ripping through this ward of elderly people). As a result, the number of tests is far smaller.
Also, our ONS survey has finished, so we have no “ground truth” of infections to compare back to. So, it’s tempting to conclude that we now have an analogous situation in hospitals to the one we saw earlier in the country as a whole. The number reported is much lower, but this is concealing the true situation, which could be far worse.
A signal to look for - percentage of serious cases
To help us to work this through, it is important to see that in our first case - the infections and cases from: 2021-2, then even if we had not had the ONS survey, we should have been suspicious that ascertainment was dropping.
Let’s plot at the ratio of COVID cases to COVID hospital admissions over the same time period as the first charts above.
Assuming 0 again - that we don’t know anything about the ONS data, we could interpret this trend in one of two ways.
First, we could say that - for some reason - the seriousness of COVID as a disease must have become a bit more than 10x worse from January to the end of 2022 - from a situation where 1-2% of cases ended up hospitalised, to one where around 18% did.
But just from looking around us, we could see that this was very unlikely to be true. A ten-to-twenty-fold worse version of COVID ripping through the UK population in matter of months, would be hard to miss. So we might suspect that instead, what we were seeing was a second possibility: that far fewer cases were being detected out in the community. And that those that were being detected were mainly the obvious ones — with hard to ignore symptoms. So, of those that were being detected, there were a far larger proportion either already in hospital, or so serious that they were much more likely to end up there.
That is, in this particular case and also in general, a significant drop-off in detection rates of any disease will tend to be associated with an apparent rise in severity, simply because the detection rate of less serious cases will tend to drop faster than the detection rate of more serious ones. In a nutshell: more serious cases are more difficult to miss, so they make up a larger proportion of a low-testing regime.
So, in order to discover whether our recent drop in hospitalisation rates is real - and given that the ONS survey is finished now,3 the obvious move is to look for a similar measure of “more serious” cases within these hospitalised ones, and see whether its ratio to all hospitalised cases has moved. If 2022-3 hospitalisation ascertainment has dramatically fallen, we would expect the 2022-3 seriousness ratio to dramatically rise.
There are at least three different measures one could use for this “seriousness” measure:
COVID deaths (disadvantage: not all go through hospitalisation first, and one might have a similar ascertainment worry about deaths).
COVID cases ending up in intensive care/mechanically ventilated beds (disadvantage: particularly sensitive to differences in the virus - e.g., Omicron variants send very few patients to mechanically ventilated beds).
A daily count of hospitalised COVID patients who are judged by their clinical team to be in hospital primarily because of the virus, rather than having COVID as a secondary or incidental complaint.4 (disadvantage, subjective judgement, appears to vary by hospital and region).
This last one - although it involves a matter of subjective judgment - is by far the most suitable. If we had started to miss patients with COVID we would expect to overwhelmingly miss those who were in hospitals primarily for other reasons (why would you test someone with a broken leg unless there was a blanket policy?); whereas those in hospital primarily because of their COVID symptoms were more likely to be tested and counted as a central part of those patients’ diagnostic and treatment programme. Note that this does not depend on these tests being performed in each and every case - we just need to assume that the tests are more likely to be performed on serious cases of COVID than less serious and asymptomatic ones.
So, we can look the proportion of all those patients admitted with COVID who were admitted primarily due to their COVID, and look for the jolt up in the ratio.
The issue is: the signal it isn’t there.
There is really one obvious feature of the chart - the massive drop from December 2021 to February 2022, when Omicron took over as the dominant strain in England. This was when we saw a switch away from 75-80% of COVID patients in hospital being there primarily because of their COVID - as Omicron BA.1 and BA.2 swept through and infected almost everyone (look at the prevalence chart from the ONS above) these people were “swamped” by the larger number of people who happened to get it in hospital while in there for something else, and the ratio dropped to the mid 30s.
But since then, this percentage hasn’t really moved much. If anything, it’s gone down. It is almost impossible to contrive a situation in which testing changes from 2022-3 started missing significant numbers of people, and it missed people with incidental COVID at almost precisely the same rate as those with it as their primary reason for being in hospital.
And if you do the same exercise with deaths, or with mechanically ventilated patients to define your “serious” cases, you get a similar pattern - no “signature” of lower ascertainment appears - and it’s very difficult to see how this can be, if it is indeed lower ascertainment that is driving the overall numbers to fall.
Of course, the converse is also true. Right now, hospitalisation rates are rising fairly quickly, and I have no doubt at all this is a real effect, rather than being some phantom effect of some new testing regime where more tests are being done as we head into winter.
It’s certainly true that data cannot always be interpreted at face value. The case rates we started with certainly told a misleading story. But this is not to say that you should always reject a straightforward interpretation (or indeed to reject it when and only when it conflicts with some pre-existing narrative).
Instead, so long as you are clear on what you are trying to measure, there is always some ground truth, and it has a tendency to leave fingerprints. There are almost always clues in the dataset itself - or in some supplementary measures - that show you where and when you have to take care.
Since tests give an incidence (how many new infections detected) and the ONS gives prevalence (how many infections detected) you need to assume a mean time-window of detectability to get an ascertainment figure. I have assumed 14 days. However, the relative drop-off (i.e., the more-than-ten-fold decrease) is not affected by this choice.
A similar dynamic of rule change happened in all countries. However, it is only in the UK that we can quantify the effect.
A winter-only version is coming in November 2023, and - though of smaller scale - will give a great deal of insight, and - among other things - confirm or contradict some of the inferences I’ve made in this piece.
In fact, if you choose either of these other measures, you get the same result. In each case, the relevant ratio doesn’t move up.


