
After each party’s convention, polling tends to rise for them for a little while, before falling back. Historically, it’s been a pretty dramatic effect, but it’s been falling off in recent years.

So, if you want to make your ongoing forecast for a read on election day, (everyone does), and you believe in a convention bounce in 2024, then your model might be distorted post conventions by positive poll readings that will soon dissipate.
Therefore, you choose to set up your model to make allowances for this effect - and not to be temporarily “fooled” by it. Here’s how everyone does it.
The Economist, Data Diary, Decision-Desk HQ, PEC. As far as I can see, here they make adjustment at all and just ride out any bounce.
FiveThirtyEight - measures what size of bounce is happening just after a convention, and subtracts any of this immediate effect from its election day forecast, before slowly reverting to the polls. This year, the bounce measured was +1ppt for Trump and zero for Harris, so there were essentially no adjustments in play by the time we got to September.1
Silver Bulletin - assumes a bounce is happening at roughly historical levels, and subtracts it from the current polling. This means applying a “time-shaped” drag to the poll readings on each candidate - to Trump on polls taken in late July-August, Harris on polls taken in late August to September.
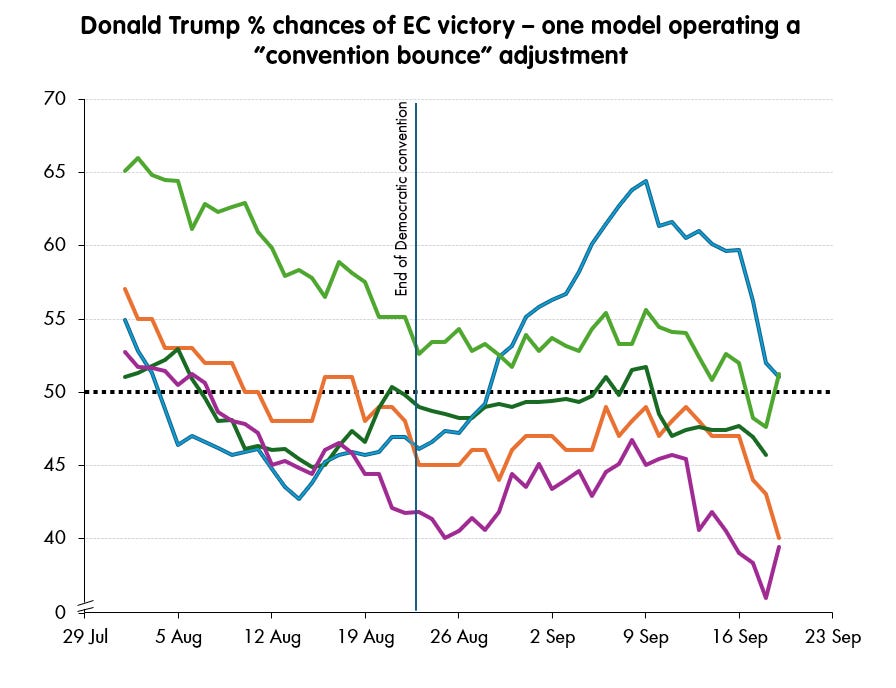
This difference in approach rather obvious when we look at the outputs of these aggregators and modellers over the course of September, after the Democratic convention. Only one of the poll aggregators has made an adjustment for a sizable convention bounce for the Democrats, i.e., a drag on Harris, and so effectively a boost for Donald Trump, starting on the 22nd August.2
It’s fairly easy to guess which one - even with the labels removed.
Fortunately - and to their credit - The Silver Bulletin provide enough of the outputs of their model to give some insight into the effect of their adjustments. They come in at the state polling level, and in the shape of additions and subtractions from each candidate.
There are two key pieces of data - first, what is the size of the adjustment on the state-level polling margin? This is given directly. And second, what effect does that state-level polling margin have on the national probabilities? And here, they give enough detail on sensitivities to get a reasonable fix on what this is likely to be.
Here’s some selected states, and their effect over time on Harris’ polling margin, under the “Adjust for bounces and recent events” line in one of their model output downloads.3