Bullet dodging
Some of the first numbers linked to NHS pressure for late December 2023 have arrived, and they suggest … it was not nearly as bad as December 2022.
These are the ambulance handover times for NHS trusts (average time, per day, it took to get a patient from an arrived ambulance, into the emergency room). The target is 15 minutes, but it’s nowhere near that nowadays, so let’s just look at the comparison to a few previous years.
As is obvious, the handover times in December 2023 were nowhere near December 2022, they were about half as long (although 2023 was worse than any other year than 2022 - and this continues to hold even when you look a decade back, though the data comparison gets more and more tricky).
And this is true even in the Trusts that have historically been under the greatest pressure. Here’s Plymouth’s Derriford hospital.
So, does this also mean that NHS pressure was also about half as bad as last year? I said that I thought that this pressure would get comparably bad to the worst of December 2022 by the first few weeks of January, and these numbers are already very much indicating that I was wrong.
I think the evidence is indeed starting to pile up that I was wrong. Which is very good, because these types of pressures kill. But before celebrating a bullet dodged, there are three points that give me pause: an unfortunate choice of indicator, the impact of the strikes and the timing.
Ambulances as indicators
First, I framed the main indicator of NHS pressure as the ambulance response times (which are very closely related to these turnaround times). And while this served well as an indicator during 2021 and 2022, it turned out to be an unfortunate choice, because in late 2023, there was a strong policy directive within the NHS that ambulances could not be used as they had been, as “mobile wards” that could be left queueing at the A&E door while patients were treated inside them. Instead, more or less whatever the state of the A&E department, the priority was to unload patients and get out on the road again.
There were various attempts to implement this, but the most stringent happened in early December 2023, and I don’t think it’s a coincidence that you can see the handover times plummet from about the 8-10 December. This effect is visible on the overall England chart, and it’s starkly obvious on the one for Derriford, which up until that time was tracking pretty much in line with 2022’s performance.
Now, there are reasons to believe that - heartless as it might sound - this new policy might be a good one in its own right. But it also means that a comparison of handover times from 2023 to previous years is certainly not comparing like-for-like. Even a higher pressure on NHS services would not produce comparable handover times to last year. A&E wait time data are much more shonky numbers, but they might now be more comparable.
Sign to watch for: Ambulance waiting times for December 2023 not being too terrible (comparable to November 2023), but A&E waiting times are.
Junior doctors strikes are … helping?
Second are the strikes. The longest in NHS history. I tried to annoy everyone (and somewhat succeeded) by pointing out that the government and the more predictable of the client journalists, would do everything in their power to blame these strikes for any collapse in NHS services that occurred in approximately the same time period, and this - at least - has come through (the editorial line of the Telegraph is far, far more predictable than pandemics).
What I only mentioned very tangentially1 was that these strikes might actually help. When you have no junior doctors, hospitals have no choice but to cancel elective procedures, which frees up beds. Also, you have a bunch of far-more-senior-doctors-than-usual assigned to the “front door” of the hospital, able to make important decisions fast. Anecdotally, this has helped the situation in emergency medicine enormously (more than I expected) while also - of course - not being sustainable, since it makes the longer-term waiting list situation worse.
Sign to watch for: Turnaround times dropping and bed availability getting better specifically during the strike weeks, while waiting list numbers jump in December.
Timing - you boy, what day is this?
The most important one. I felt that the worst pressure would come in the first couple of weeks in January - a few weeks later than in 2022/3. And this data stops in December 2022, with the usual Christmas confusion messing up the last few days.
What really matters for the underlying pressure is two things: COVID and flu. And if they’ve both peaked, and we’re on the way down, then the bullet is probably dodged. And there are definitely signs of this - especially for COVID, which looked to be slowing even pre-Christmas, despite its JN.1 vigour.
(Source: UKHSA, via Stuart McDonald)
However, the latest read is complicated by Christmas (again; the amount of effort people go to not to be in hospital over Christmas is quite extraordinary). And flu is not showing so many signs of slowing, and is in fact responsible for more admissions than was COVID in the last couple of weeks of 2023.
So, tomorrow’s read (showing up to the first week of January) will be interesting. If the slowing of the COVID wave continues into a proper peak and fall, and then flu follows last year’s pattern (a sudden fall in the first few days of January) then we are past the worst and heading for an improving situation - we simply won’t get to the admissions pressure that I’d projected for January, and we’ve dodged the bullet. If they haven’t, then that bullet is still approaching.
Sign to watch for: 9.30am (or slightly before) on Thursday 11 January 2023 - the COVID admissions numbers.
The most important factor - a real effect
Even taking into account all of the above, we are still in a much better situation than I had expected at this point - especially on COVID hospitalisation pressure, which is hovering around half last years’. And all this is in spite of the fact that the new ONS/UKHSA winter survey has confirmed that the infection rates of COVID are fairly similar to previous peaks (and easily as high as last year in the relevant period).
From this, we can infer fairly confidently that the thing that’s really turning the dial vs the pressure last year is not NHS policy, not strikes, nor even timing. What’s more, it’s a real effect, not something messing with an indicator, or shifting operational pressure from one place to another.
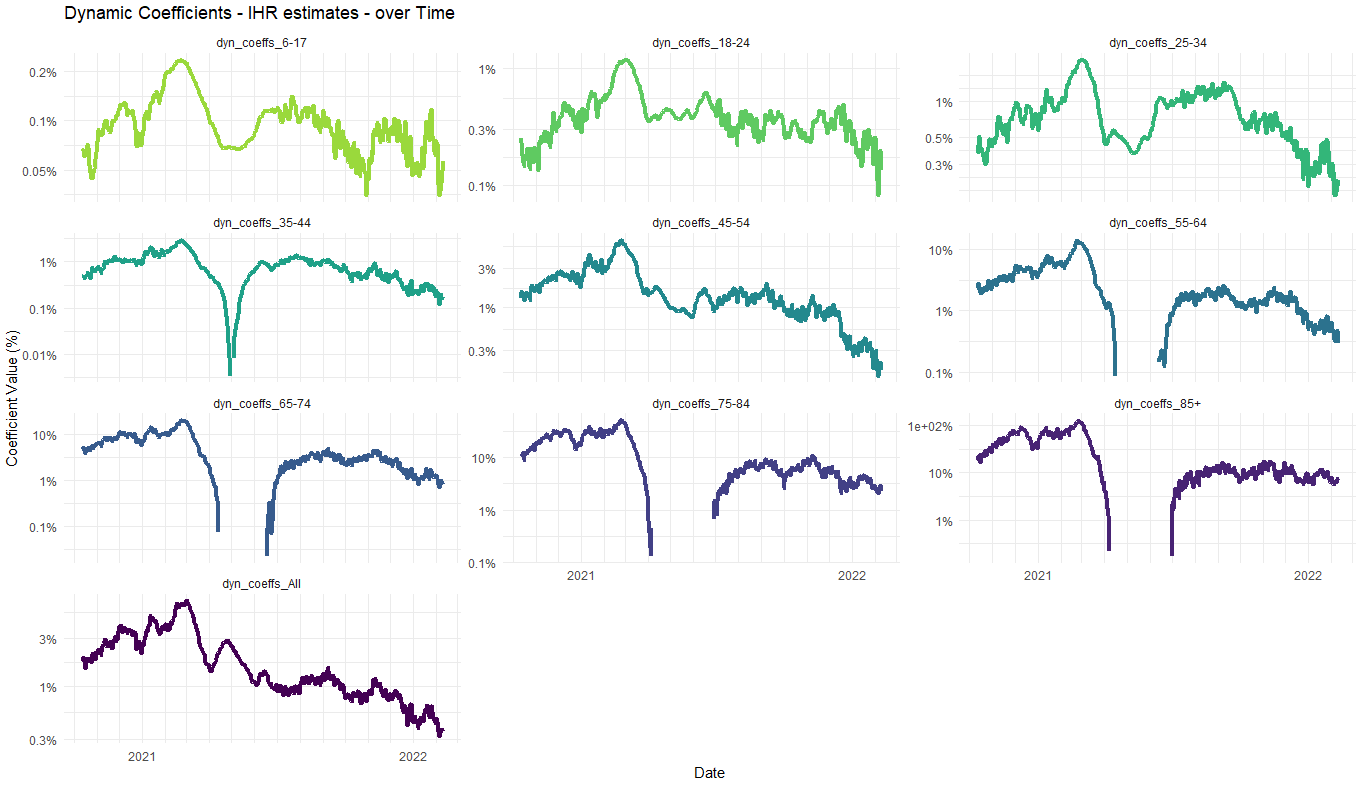
What’s making the biggest difference is that the IHR - the infection hospitalisation rate - of COVID, and the fact that it has clearly plummeted once again since last year. Even versus the absurdly large falls we previously estimated after the introduction of vaccines (factors of 10 or more for the most important 65+ age groups), they must have gone further down since then.
(Explanation of what’s going on here, and note the logarithmic scale)
At the moment, it is almost impossible to get clean numbers because of timing issues (infections are soaring, and the so are hospitalisations, so a small offset in the curves can give you totally different answers; you need a peak in both to compare). But in order for the numbers to be consistent, we must be looking at something like another halving of the IHR since the end of 2022.
Whether this increased protection has been achieved through carefully targeted boosters, or via increased natural immunity through infections in the course of the year, it appears to be this IHR change that has had the largest effect in reducing NHS pressure versus what you’d expect to see, and is well on its way to proving me (very gratefully) very wrong.
All I said was: “Paradoxically, it’s possible that this last bit might even make the situation slightly better, by freeing up beds.” I didn’t recognise the “senior-doctors-on-front-door-is-transformative” aspect, which clinicians on the ground say is the really important point.


