
Convergence - of a sort
Convergence - of a sort
IHRs by experts and others

The latest (and perhaps last) Winter Coronavirus Survey has come out, and the team have delivered on their promise to producing their promised Infection Hospitalisation Rates - that is the chance that someone infected with COVID has to be hospitalised with it.1
Here they are:
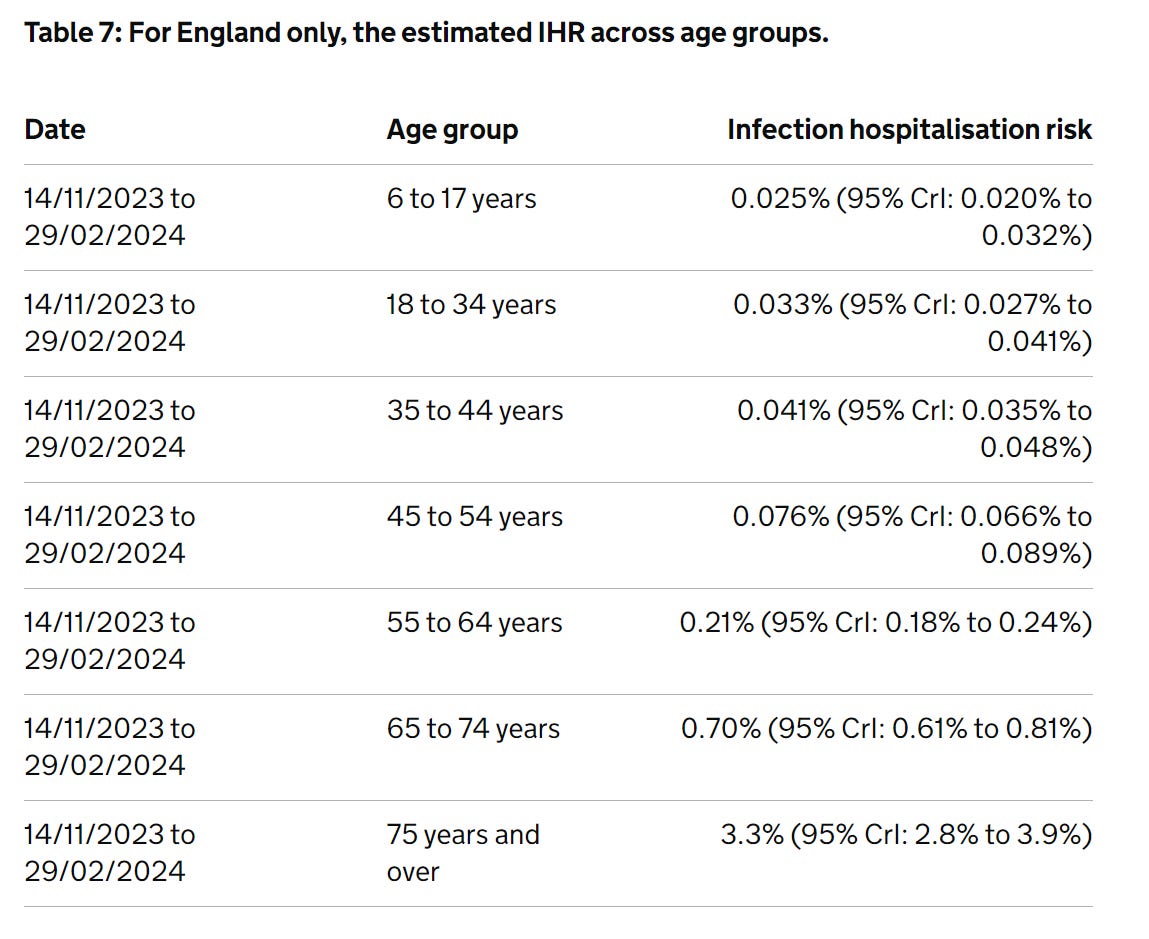
OK, comparison time.
Now, I - in my scrappy way - also had a go at producing IHRs. A long time ago, with much less resource. Or error checking. Or competence. Or responsibility.
So no doubt they’re much less well-conducted than these UKHSA. But let’s not that get in the way of comparing them anyway.
Here’s my results (which used a dynamic linear model on data from the predecessor to the Winter Survey: the full COVID Infection Survey):
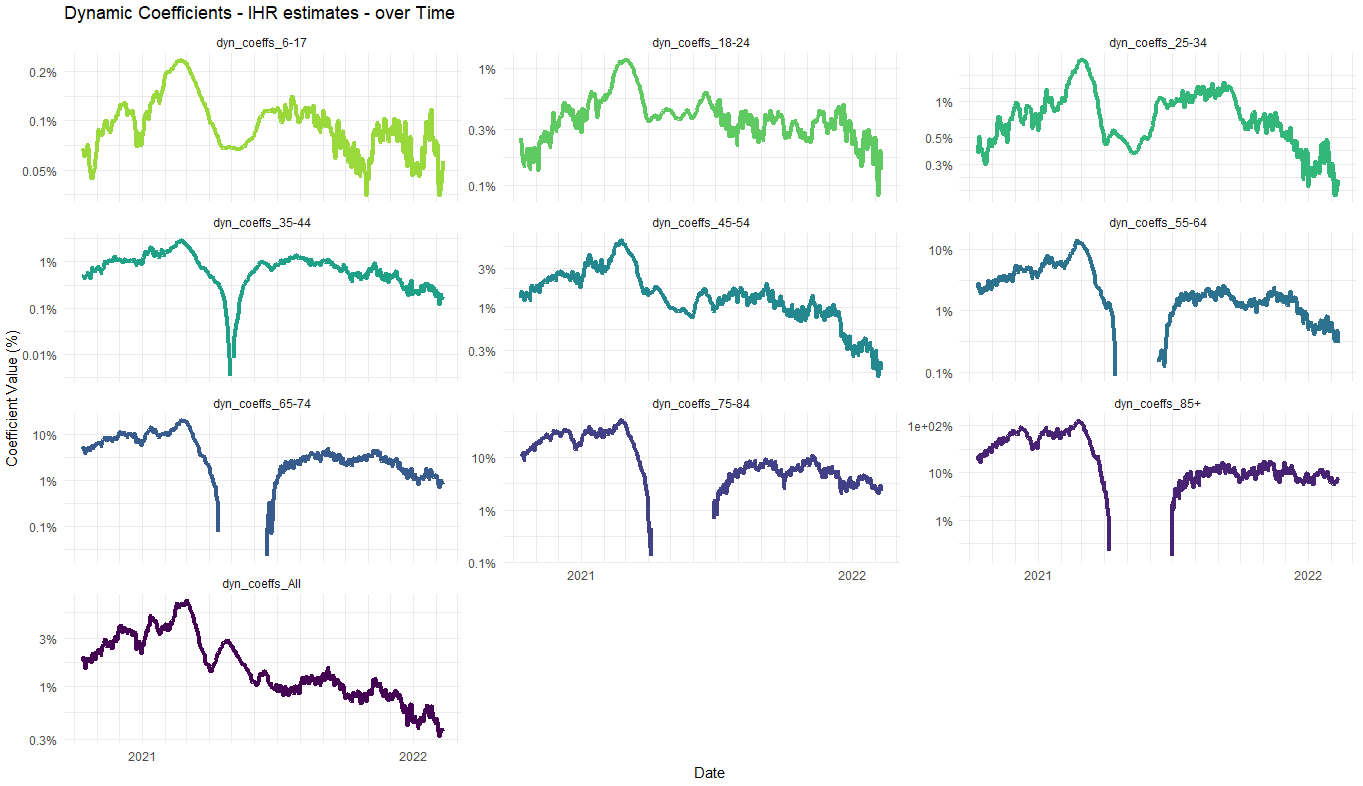
Now, infuriatingly, the age-ranges don’t line up (please, please just pick one set of age-ranges, COVID Infection Survey people), but you can see the rough patterns - e.g., for 75+ my early 2022 numbers come out as a weighted average of ~5%, and now it’s 3.3%. In 65-74s, I had 1%, and we’re now at 0.7%. I had 0.3% for 55-64s and we’re now at 0.21%. Overall, in these age ranges - which make up the vast majority of all COVID hospitalisations - we’re seeing a fall in IHRs of around 30% between early 2022 and 2023-2024.
As you go younger, it’s more difficult to tell - variance is high and dynamics tricky - but the falls look even larger.
20 is close to 30, right?
This is encouraging, because it lines up pretty well with my earlier investigation of the age-profile of the far lower COVID hospitalisation levels in the winter of 2023-4 than that of 2022.
There, I did a different (and mostly independent) calculation which worked from the overall hospitalisation levels and the age-profiles of the two peaks, to leave the age-specific IHRs as a result. I came to this:
… with this closer look, I don’t think the age-specific IHRs have halved. I think each have come down by about 20%-ish in that time, and the remainder of the effect is due to the different age profile of infection in the December 2022 and December 2023 waves.
However, these two effects together do give a total effect of about half the number of people in hospital for the same overall size of wave - the overall IHR. And even though we’ve spent some time breaking it into its component parts, this shift is important: probably the single biggest contributor to the fact that NHS emergency care did not collapse as badly in winter 2023 as it did in the previous year.
So, this lines up OK-ish - the direct comparison of two sets of numbers calculated by different teams at different times shows a 30%-ish drop in age-specific IHRs, versus a 20%-ish drop given by the indirect method.
There’s a difference between -20% and -30%, but honestly, given all the uncertainties here: the time shifting of the infections and hospitalisations, the two different infection survey methods (one with PCRs, one with LFTs), the different ascertainment rates, the calculations by two different “teams”2 and the time-windows in each case, I’m amazed these two approaches are so close. No doubt we are seeing errors in different directions cancel one another out.
So bloody what?
The Winter Coronavirus survey also gave one more piece of information. Infections are dropping again.
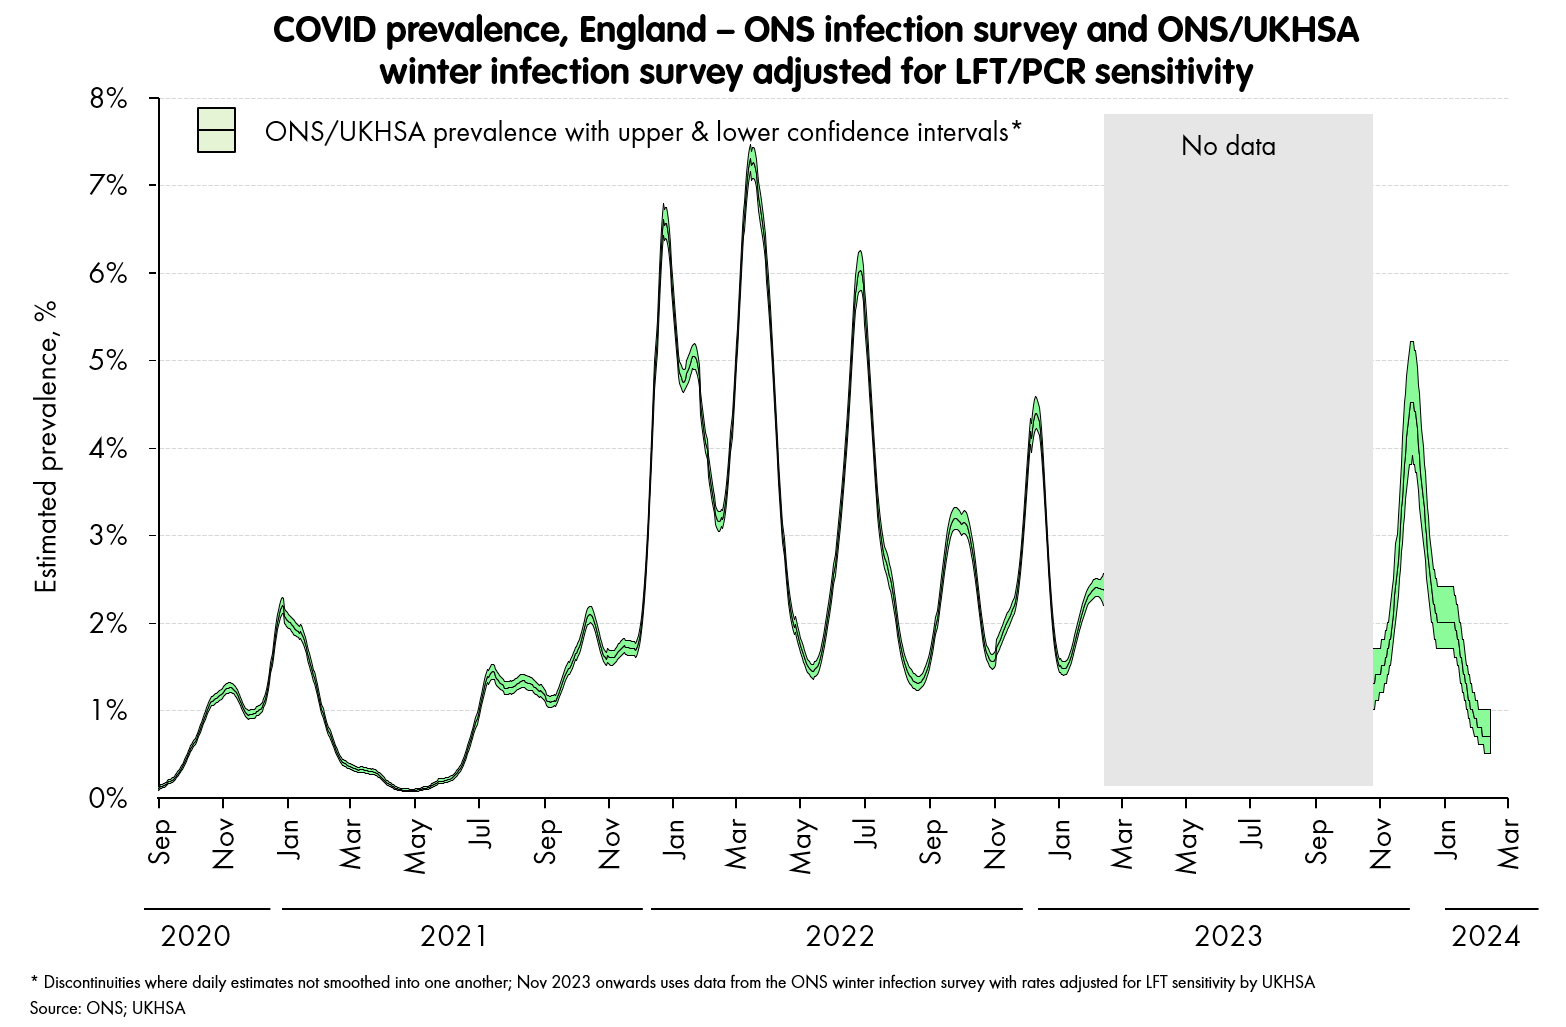
That is, the estimate of prevalence (how many people have PCR-detectable COVID at any time) is now down below the floor of ~1.5% that we’d not managed to break through in 2022. And, as we start coming out of winter, we could go even lower, though as in the last few years, we should expect a few spikes even in summer as new variants come through.
With these low rates, and the IHRs also 20-30% lower than we saw in 2022, with the oldest able to secure seasonal COVID jabs, and the NHS showing it can get through a winter with a full-on COVID spike on top of a flu surge without collapsing, I feel the “risk temperature” of COVID is low, and getting lower. It’s probably as low as it’s been since when Omicron arrived. Depending on your level of vulnerability, it might even be as low as its been since the pandemic began (though it’s hard to beat that few months in 2021 when we’d just got the vaccines and were yet to see Delta.) Things could go wrong of course: a radical new variant could change everything; but by and large, the situation is about as good - and also as clear - as it has been for a while.
Yes, “with” - not for. This definition is not ideal, and slippery - there are people who have COVID as the only reason they’re in hospital, those who have it exacerbating other respiratory and heart problems, and there are those with broken legs who happen to have been unlucky enough to get COVID too. But, it’s the data we have in the needed level of detail, so it’s what we’re using.
I think of myself as a top-performing team.
Nice! To be fair, based on admissions and deaths being so low then it's likely we were quite a lot lower than 1.5% prevalence last summer (in the period when ONS wasn't running), but that's a pedantic quibble and I certainly agree with your overall positive assessment.