

Signs of desperation

If you’ve ever been part of any kind of prioritised service facing capacity issues, you may recognise the following reasoning going through your head - either consciously or not.
This incoming problem is a priority one, but in all probability, not critical.
In ordinary times, a priority-not-critical issue would take - say - 18 minutes to be dealt with. And this is acceptable.
These are not ordinary times. We are facing huge capacity issues. Anything tagged “priority-not-critical” will take upwards of an hour. And this is no way acceptable.
Therefore, I may be very tempted to use my discretion to upgrade the issue to “critical” and have it seen within 18 minutes.
This reasoning can be done at any level - at leadership level where the different categorisations are made; at front-line level where the determinations are made, or even by the users themselves, where - aware of the capacity issues - they may be tempted to up-play the severity of the issue they are facing.
Wherever this happens, it is of course a bad thing. The whole point of the prioritisation system is to distinguish between the most serious issues needing the most urgent response, and slightly less serious ones which - in comparison - can stand a little longer. Smush them together, and you lose this “comparative advantage” which was the point of the categorisation in the first place. The most serious problems are the ones who will suffer, because they will start to be stuck in a queue behind less serious ones, which have been artificially classified as equally urgent.
Anyway, on another topic, we have previously seen England and Wales’ ambulance times escalating in Q2 2021 for the “Category 2/Amber” response times to quite absurd levels; from their target 18 minutes to well north of an hour.
(Yes we have “previously seen” this, I’ve written about it loads.)
The times look like this.
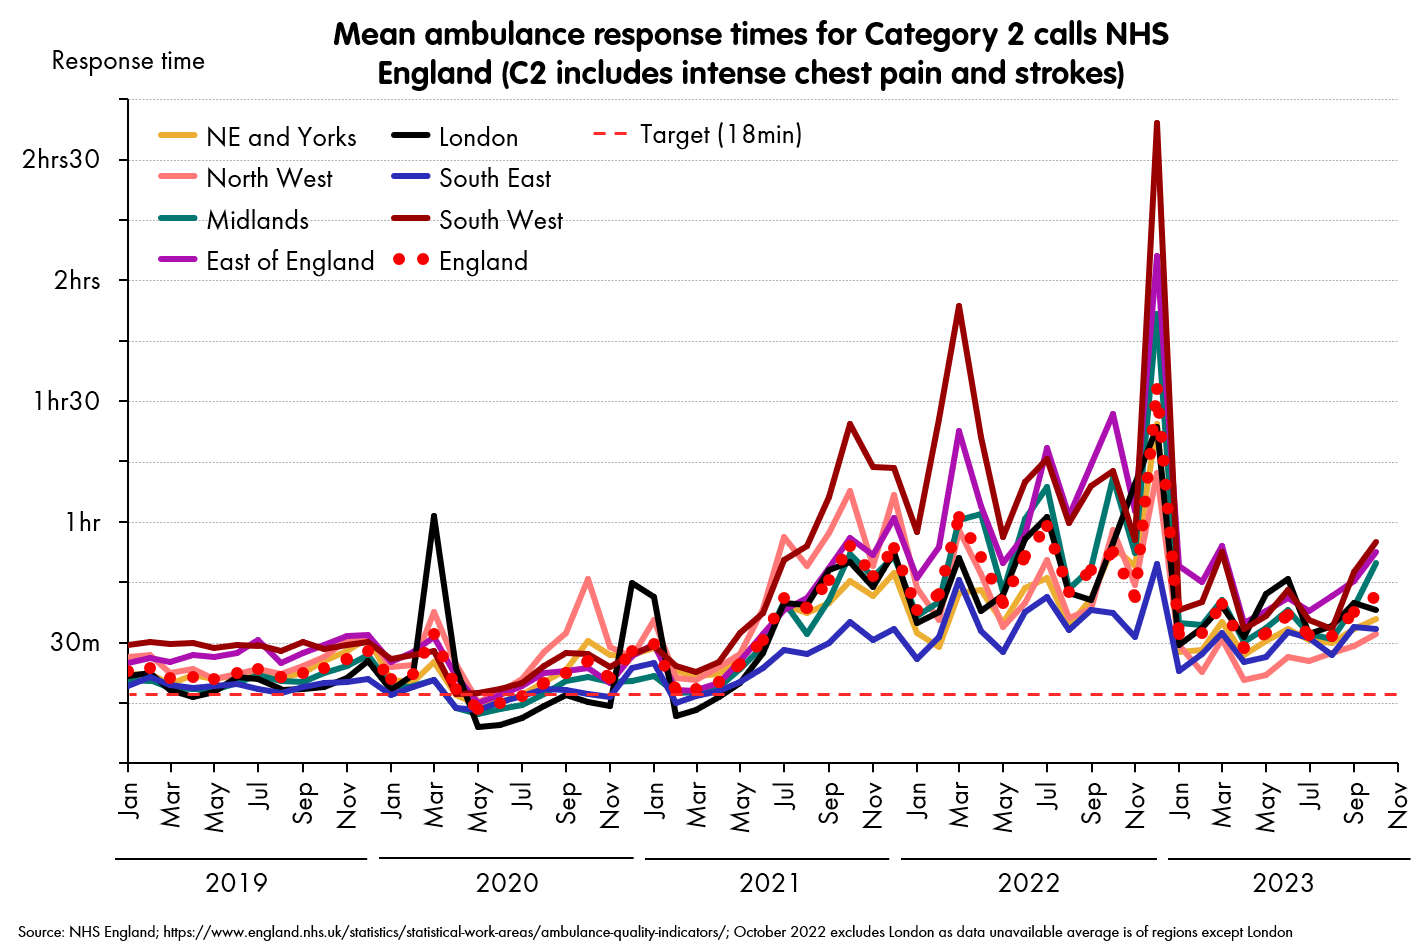
Actually, that was just England. Wales reports times differently (they use medians, which are typically shorter than means for the lognormal distributions that ambulance times tend to fit) and their categories are defined differently (“Reds”, “Ambers” and “Greens”), so I’ll put the times for their second category: “Ambers” on a different chart.1

There are differences between England and Wales (and their constituent regions), but the main themes are the same. Both nations have regressed from a bad-but-liveable state pre 2020 to a terrible state, with the peak of awfulness December 2022.
And while both saw regional problems pre-2021, especially during the pandemic but for both England and Wales, the real escalation to a new plateau of awfulness happened in Q2 2021.
Another thing common to both England and Wales, was there wasn’t any associated escalation in demand over this time. This is true both in total load, and in our focus here: the critical and urgent categories. Here are the top two priorities of ambulance calls for both systems.

This is worth emphasising. There does not appear to be an increase in the number of calls - and certainly not one that correlates with the escalation of response times.
However, there was a striking pattern in the share of Category 1s/Reds calls - that is, the share of the highest category you could be in.

It is also worth noting that in Scotland, where problems with response times were much less serious, we did not see the same effect - proportions of the top category stayed within a few percentage points of one another throughout this time period (though Scotland has different categories - again - and only reports data from November 2021 to present).
When I have suggested previously that - in response to the horrific escalation in response times - we might be looking at some of this “desperate prioritisation” effect mentioned above in England and Wales, I have been told - very fiercely - that this cannot happen.2 That the safeguards around Category 1s/2s or Ambers/Reds are so strong that dispatchers and other team members cannot respond to spiralling times in this way.
We do not have access to data to tell definitively whether this is true or not. But colour me (very) suspicious that this is exactly what is going on. I tend to believe that incentives and human behaviour will beat systems and safeguards every time. And that a human being on a phone to another human being will show their humanity by creating the patterns above - more or less whatever safeguards are put in their way.
It’s also interesting to note that this share of the critical calls also acts as a leading indicator of pressure. Note that for both Wales and England, they started to shoot up a month or two before the times really escalated.3
Whatever the mechanism, we appear to have yet another early-warning signal for winter capacity problems in the NHS. And - especially in Wales - it is flashing up for 2023.
While the “colour” and “number” categories aren’t directly comparable, the implication is that Wales’ situation is significantly worse. And I fear this is accurate. The fact that the Wales numbers are the median (generally ~25% lower than the mean) and the mix of different call volumes being broadly similar strongly suggests that Wales’ ambulance response times are even worse than England’s.
So I may owe the residents of Plymouth and Swansea an apology. I said that the worst time and place to have a serious medical issue in the last few decades was 29 December 2022, in Plymouth. I now think it may have been even worse to be in Swansea.
And that even suggesting such an idea was an insult to the professionalism of the hard-working staff of ambulance services.
There is an obvious mechanism by which this would happen: the spiral of longer times leading to reprioritisation, leading to even longer times, and so on. I suspect this is massively oversimplified, but that something in the region of this is what drives the leading effect.