

What doesn't kill you, can come close
Why were there so few hospitalisations in winter 2023 compared to 2022?

A few weeks ago (and a few weeks before that, and a few weeks before that … and a bunch of times way before that), I predicted that NHS emergency medicine would collapse in January 2024 (i.e., about now) under the strain of a combined flu and COVID wave, similarly or worse than it did in December 2022.
We now have enough data to conclude with reasonable confidence that both waves - flu and COVID - peaked in the last few days of 2023, so the pressure did not mount into the first few weeks of January 2024. And over that time, NHS emergency care got pretty bad, and ambulance times spiralled, but they did not in fact collapse to the extent that it did in December 2022.
I was wrong.
Even with this comparatively early peak and fall, it is still pretty surprising that the NHS did not suffer more. Even that early COVID peak - according to the ONS/UKHSA survey - was about as big as last year’s.
So why didn’t it all go south as badly as last year?
But was I really wrong? (Yes)
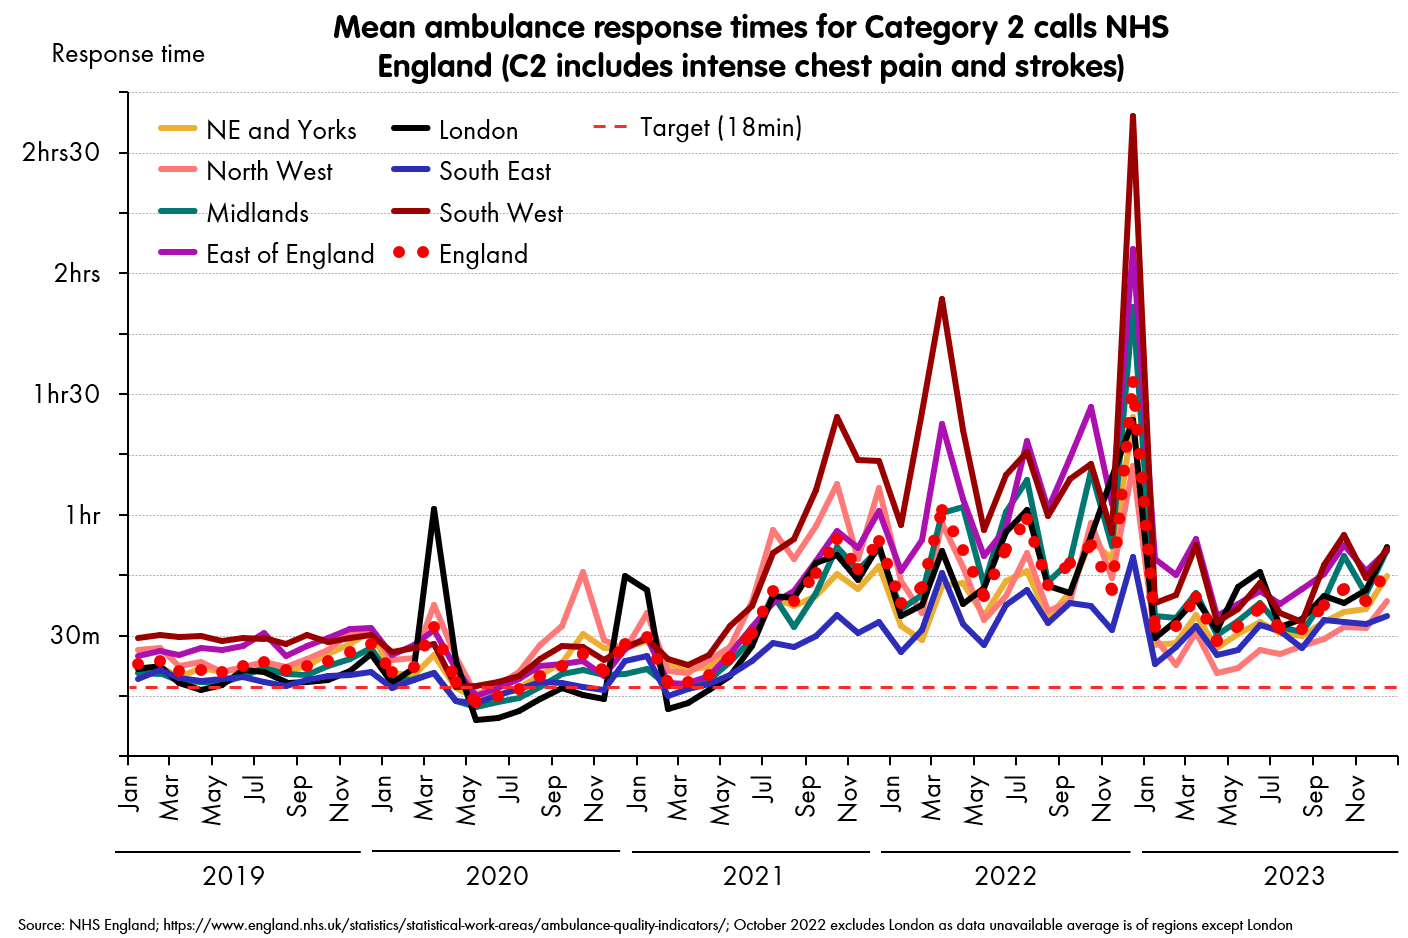
One thing to note is that the metric I’d been relying on: ambulance response times - specifically Category 2 times, ceased being a like-for-like measure of NHS pressure in the last months of 2023, due to a policy change.1
Instead, measures independent of ambulance policy, like the “12+ hour admission wait” are more comparable over time.2 That one looks like this:
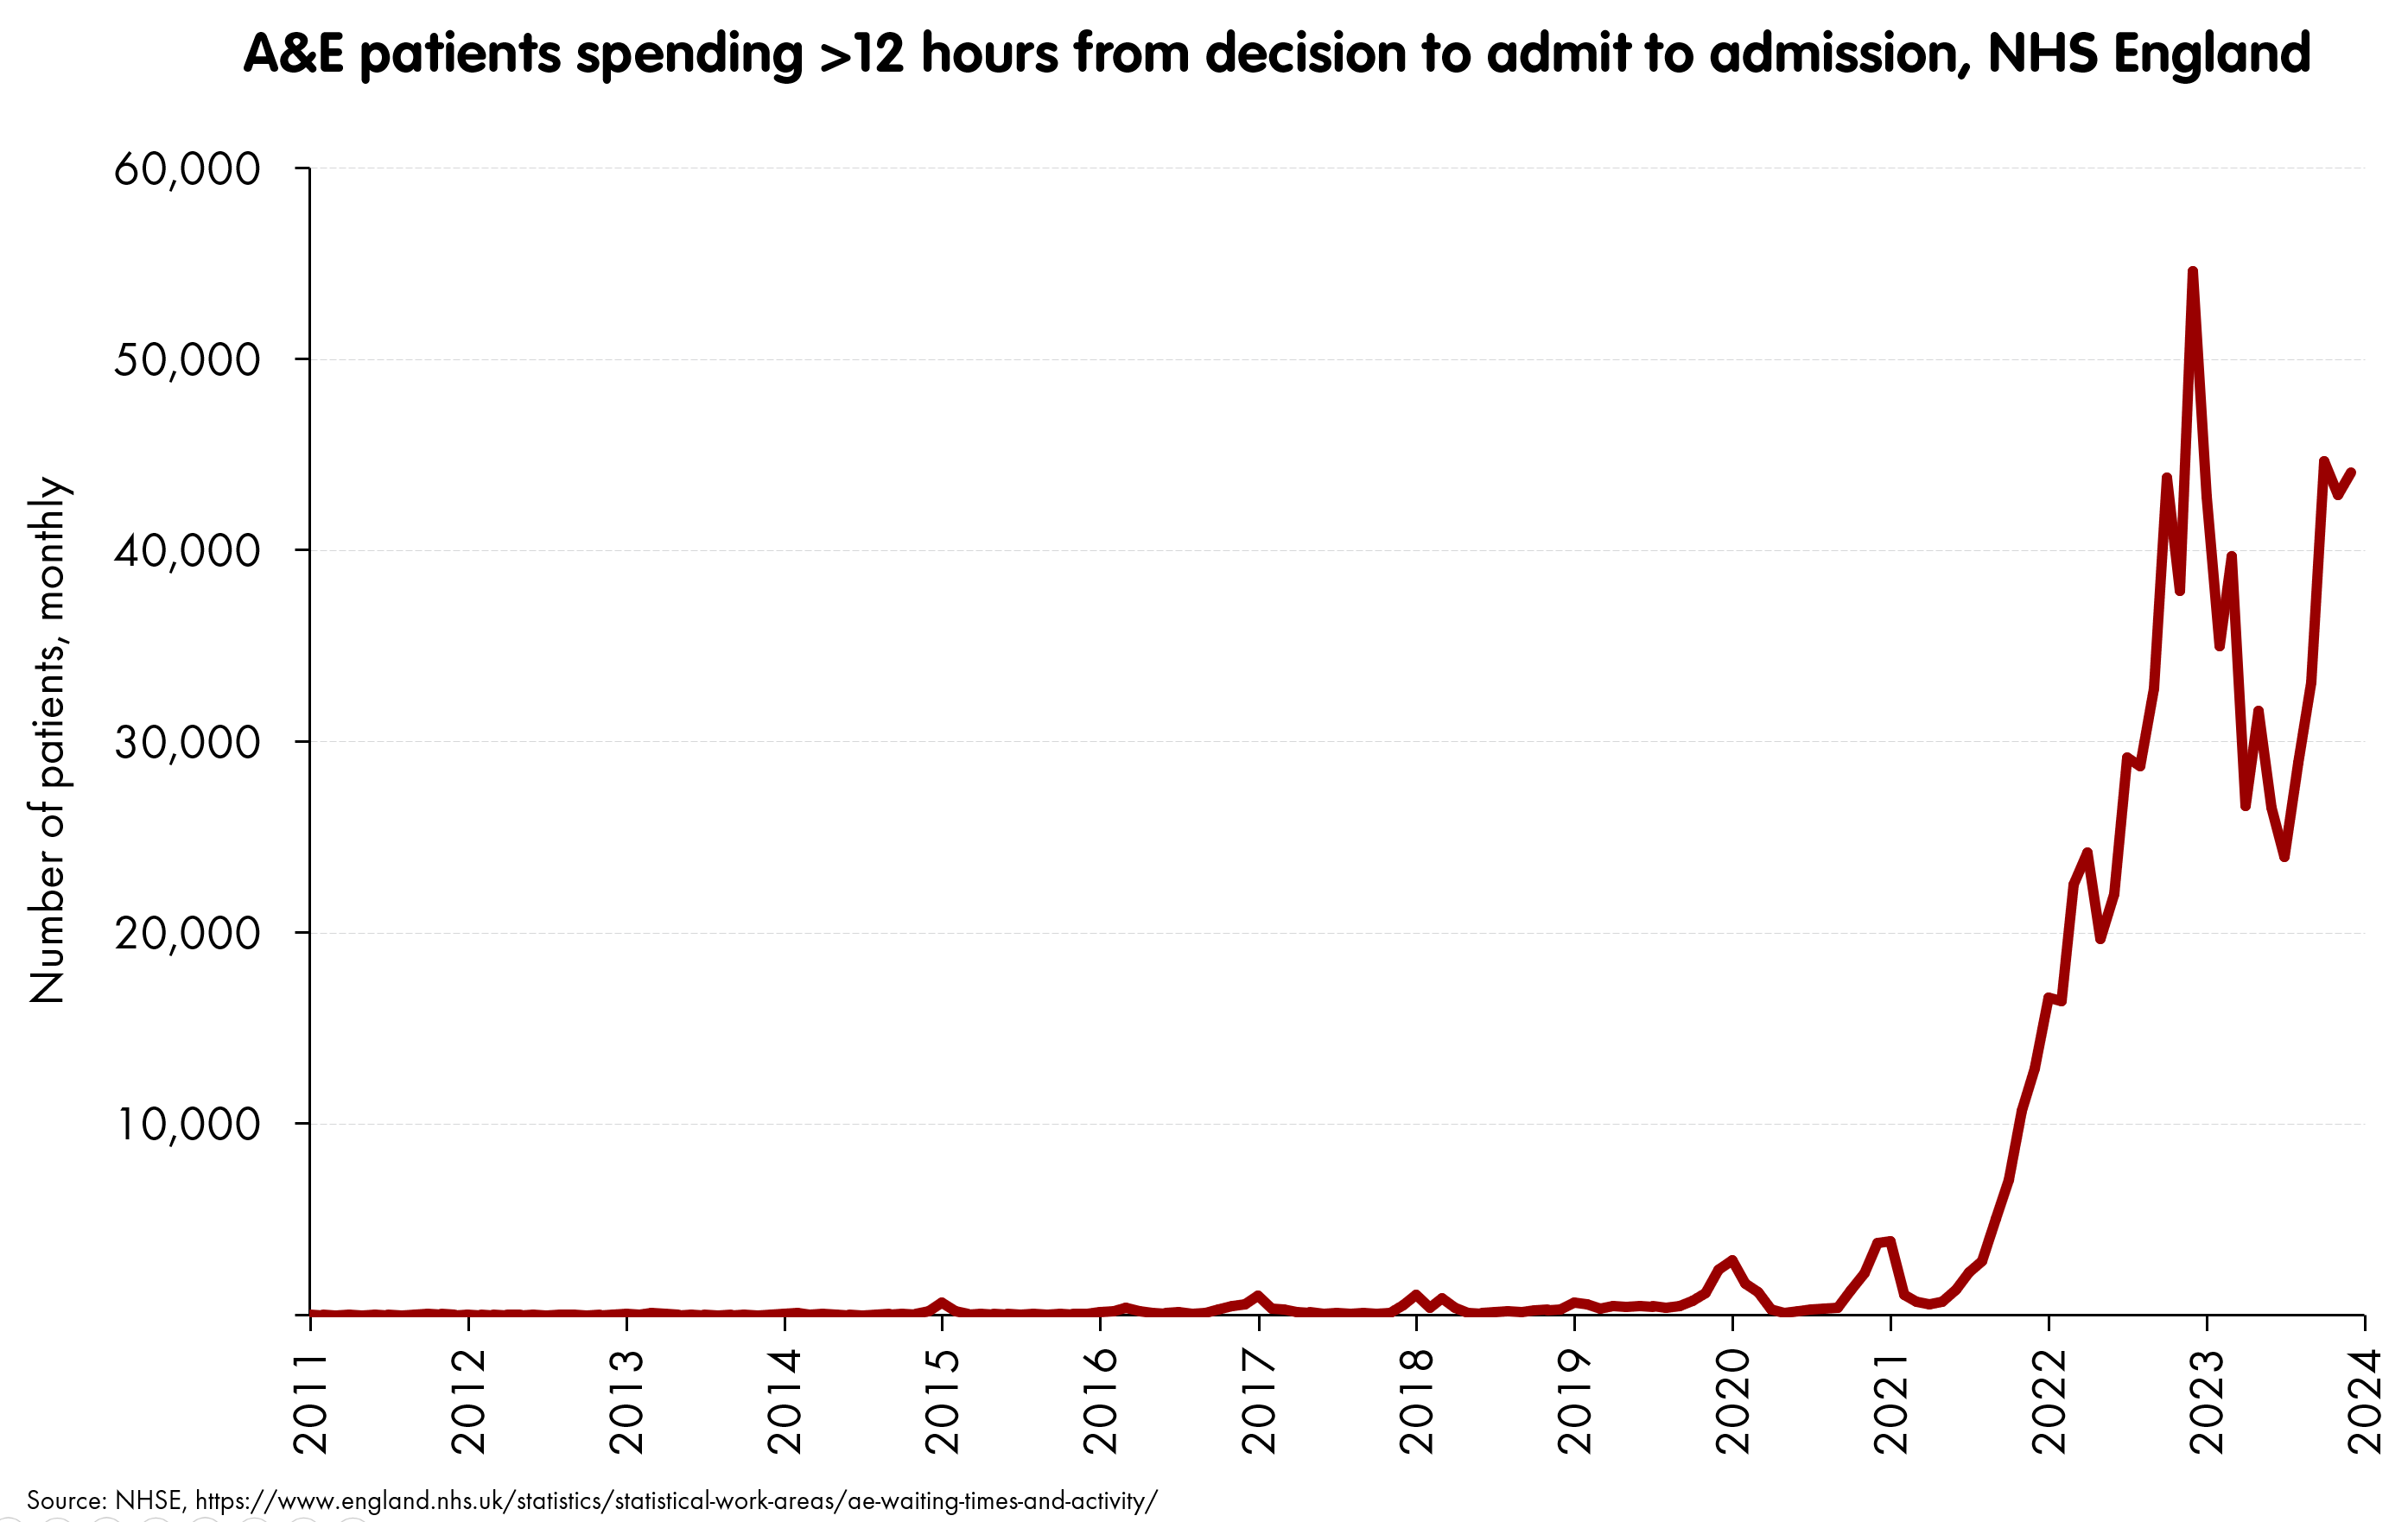
So, even if we look at these other metrics, we can conclude that emergency care really did not get as bad as December 2022 (in fact, it was only a touch over 85% as bad, at least by this measure). I was wrong, whichever metric you use.
So now it’s small child time. That is: ask “Why?” until we get somewhere.
Why (1)?
There were a bunch of differences between December 2023 and December 2022, but what appears to be the single largest one is that the hospitalisation pressure from seasonal respiratory infections did not get anywhere near so bad in 2023.
Since the bulk of winter pressure nowadays tends to be a combined effort by three respiratory viruses: flu, COVID and - to some extent - RSV,3 it is perhaps this chart from the UKHSA influenza surveillance report which best summarises the hospitalisation situation.

Both flu and COVID ended up doing a miniature version (less than half) of the hospitalisation levels they hit the year before. There were just far fewer people being sent into hospitals by these waves of infectious disease than last year, and so the system was able to hold together better.
Why (2)?
Let’s focus on COVID rather than flu.4 Why were fewer people hospitalised with COVID in 2023? Oddly, it doesn’t seem to be that we had much less COVID (or flu, for that matter). The winter ONS/UKHSA infection survey on COVID rates suggests a peak in late December 2023 of ~4.5% prevalence, which is the same, or a touch higher than we had in December 2022.

So, given we also know that there were lower COVID hospitalisations5 this suggests that we might have a lower overall infection hospitalisation ratio (IHR) - that is, each infection seems to be sending people into hospital with a serious illness at a lower rate.
Why (3)?
One reason might be the age profile. Compare this peak again, with the December 2022 one, both with an overall average prevalence of 4.5%ish, but this time, cut by age.
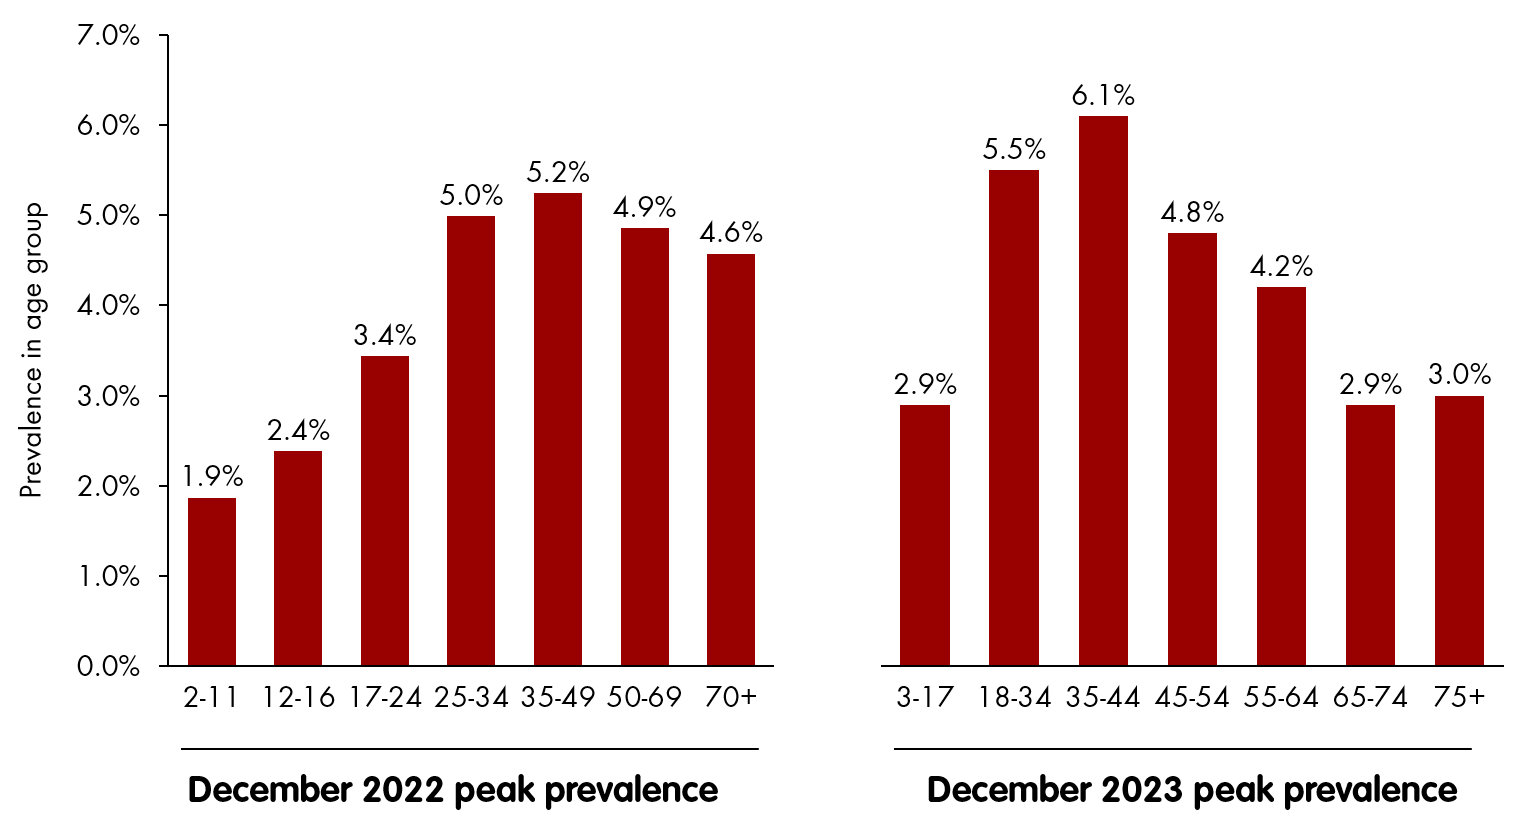
(No, of course no-one has used the same age-cuts, why would they do that after all, grumble grouse.) But despite that, you can still see that while they had approximately the same average prevalence overall, the December 2023 peak has a much bigger drop-off in prevalence in the oldest ages.
Which means - obviously - that despite the same overall prevalence, you’d expect fewer people to end up in hospital in December 2023. Older people have a much higher chance of ending up in hospital with (and for) COVID than younger. Now as to why the difference in age profile, there could be many reasons. One might be the well-conducted booster programme which was targeted specifically at the oldest at the end of 2023. But we should note that there was an autumn booster programme in 2022 too (although potentially the booster was less well-matched to the strains circulating). So … it’s unclear… let’s just settle for the brute fact that the prevalence age-profile is very different.
So, does this difference in age-profile account for the whole difference between the two peaks? Or is there another reason too?
Why (4)?
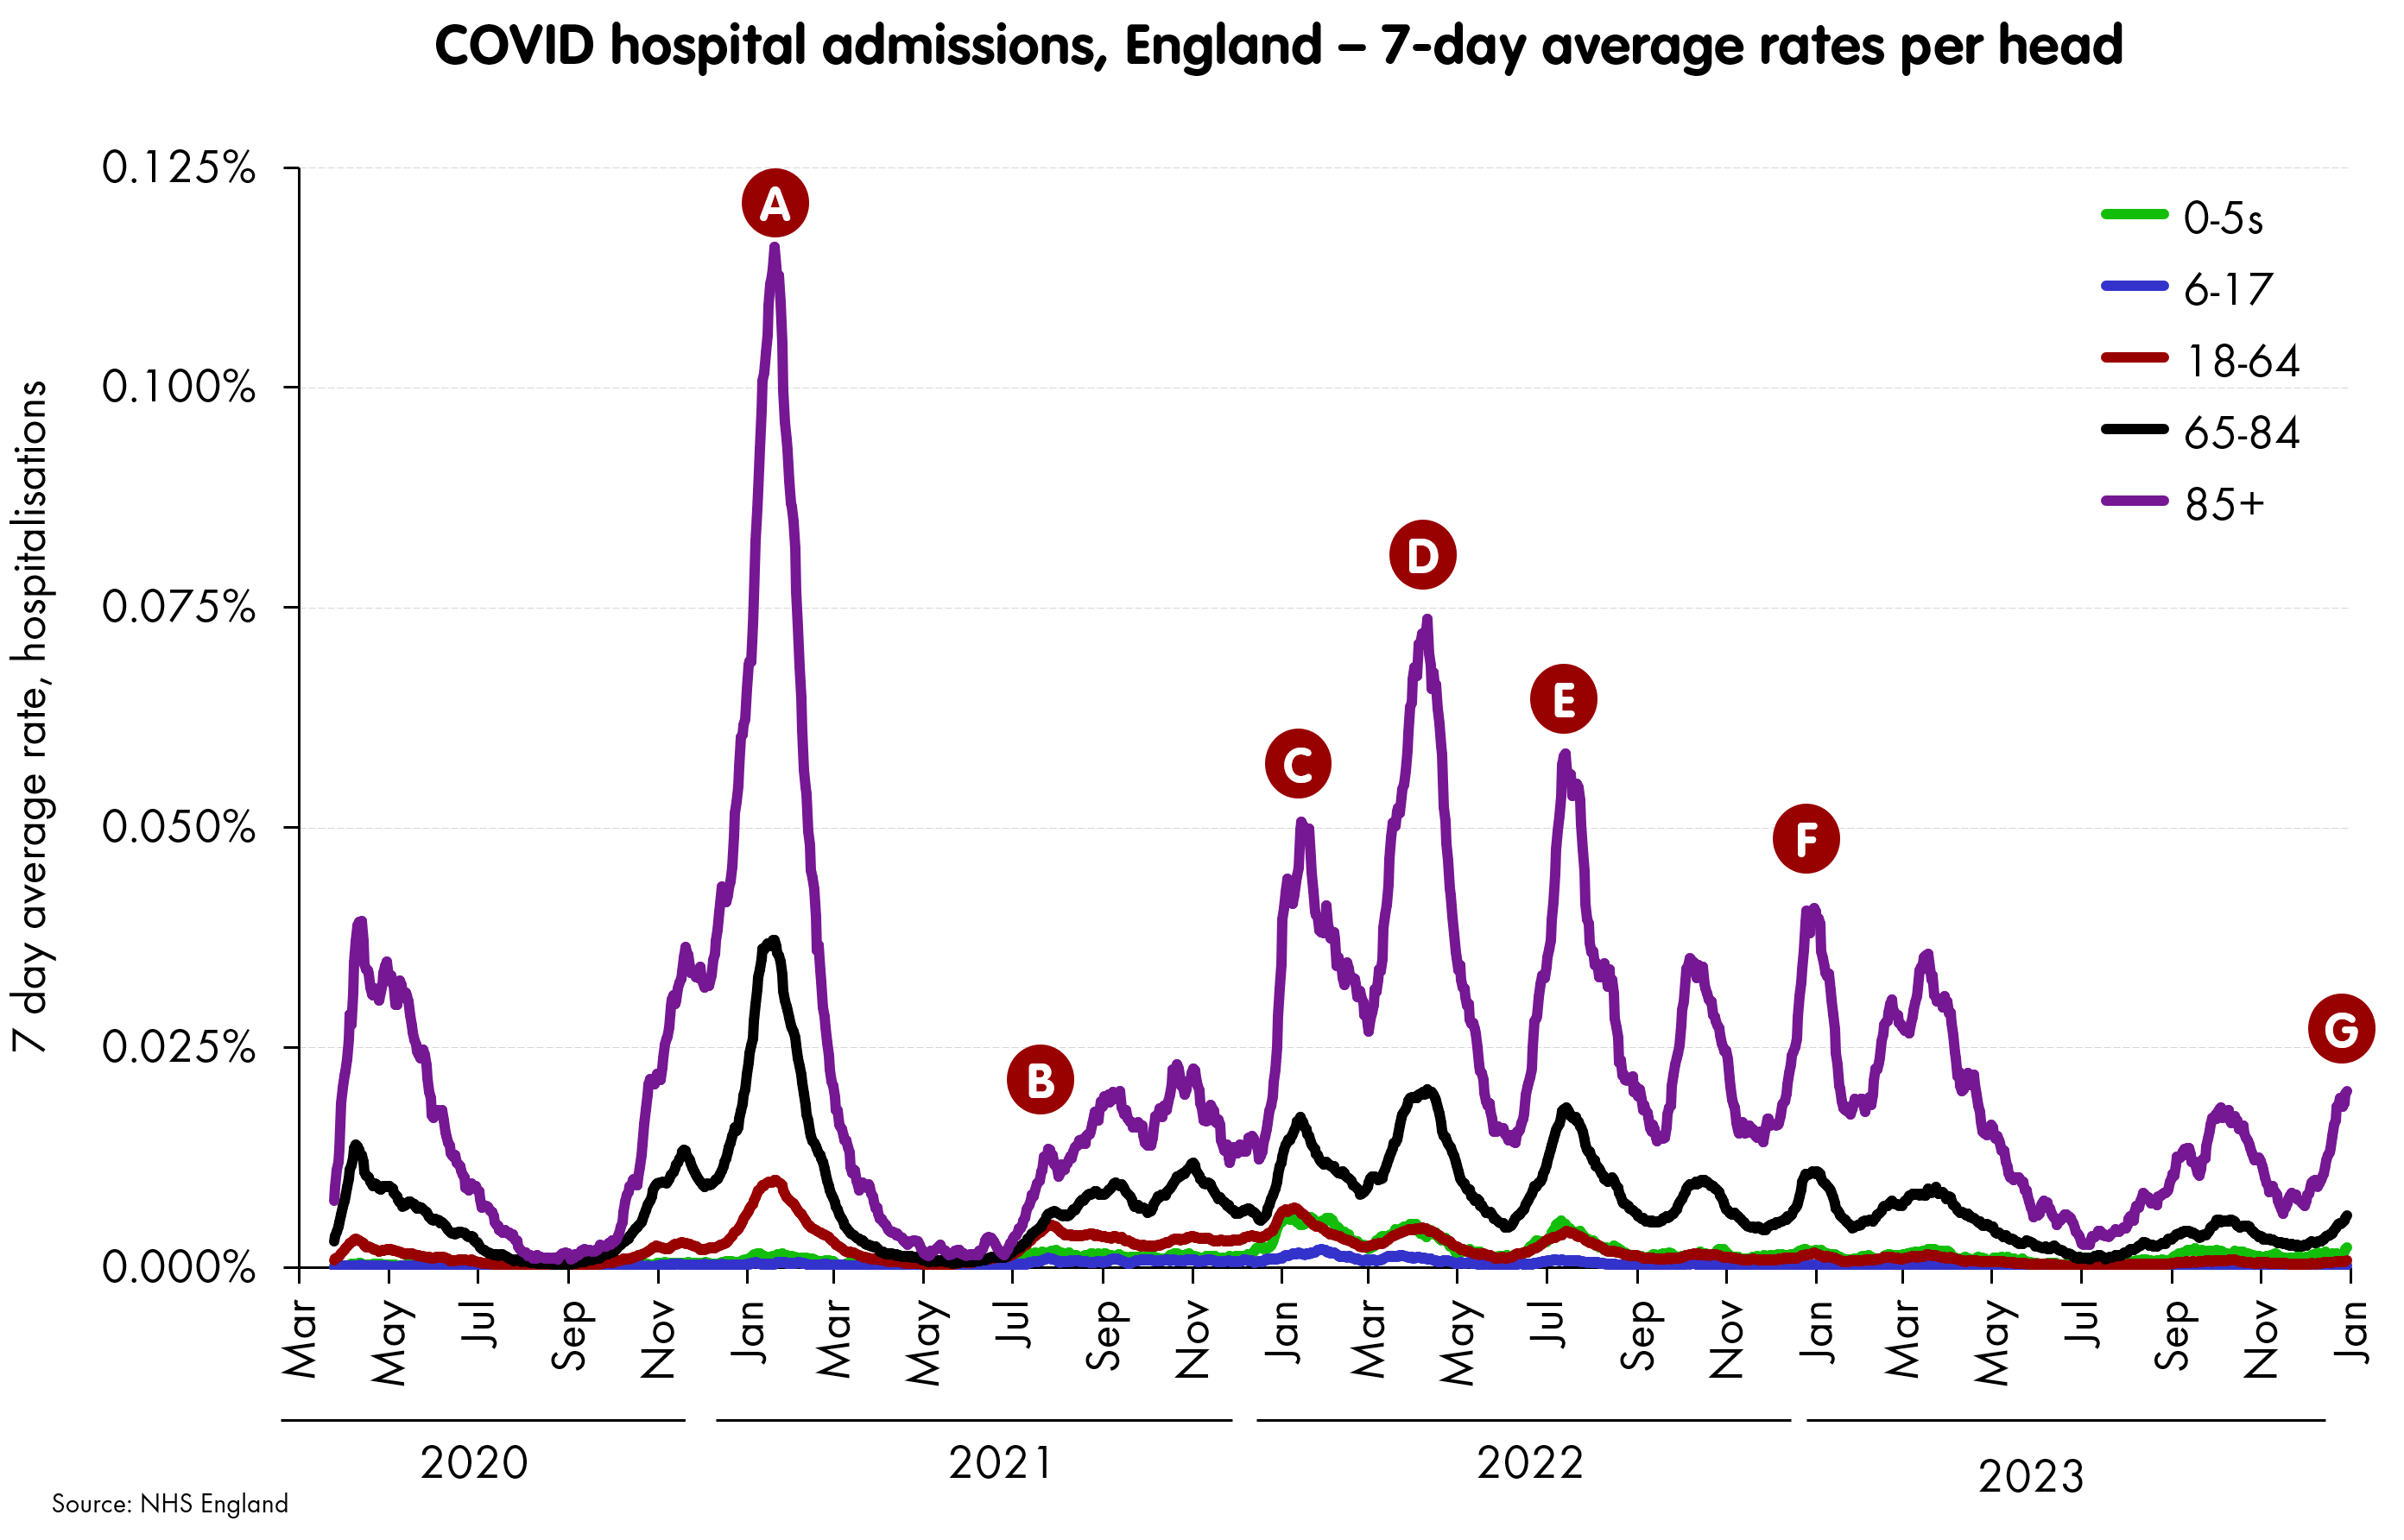
We have the hospitalisation rates by age for England.6 They look like this:
The obvious next step is to calculate the IHR - the infection hospitalisation rate - for each age-group in turn, and see if this has also shifted over time. Unfortunately, that’s difficult, for various - somewhat frustrating - technical reasons.7
What we can do instead is to calculate an “IHR-like” thing, which is to compare the peak prevalence at each age-range to the admissions peak.8 This won’t give us IHR directly, but - all other things being equal (and they are fairly equal) - it should be proportional to it. So when this quantity varies over time, the IHR should do the same.
Let’s do this for some of the peaks we can match both hospitalisation and prevalence rates - they’re labelled with letters on the chart above. We get the following:

These gives a rough measure of how many people were flowing into hospital each day with COVID, given the background prevalence.9
For those who hate reading small numbers in a table, the striking points are as follows.
It’s not a good idea to be old - particularly at Peak A, the pre-vaccine peak.
The two big drops in the ratio were between Peak A and B (B was the first peak after most had at least got first vaccine doses), and then between Peak B and C (C was the first Omicron peak, as well as the + boosted peak). In each case the ratios nearly halved in each case for all of the the ages above 18. There was little or no difference for <18s.
And then finally, on the question we’ve been asking, increasingly urgently:
There is a drop between peaks F and G (i.e., December 2022 and December 2023), but it’s closer to -20% or so than another halving.
So, this is a fairly significant row-back from something I claimed the other day, when I said that I couldn’t get the infection and hospitalisation numbers to be consistent unless the IHR had halved in the last year.
In fact, with this closer look, I don’t think the age-specific IHRs have halved. I think each have come down by about 20%-ish in that time, and the remainder of the effect is due to the different age profile of infection in the December 2022 and December 2023 waves.
However, these two effects together do give a total effect of about half the number of people in hospital for the same overall size of wave - the overall IHR. And even though we’ve spent some time breaking it into its component parts, this shift is important: probably the single biggest contributor to the fact that NHS emergency care did not collapse as badly in winter 2023 as it did in the previous year.
This policy change - to pack patients into hospital corridors rather than treat them in the back of ambulances - is has positives and negatives, but on balance it may well help patients, and could have been imposed a long time ago. But whether it’s good or bad, it means that ambulance response times pre and post Q4 2023 cannot be compared as a measure of overall emergency NHS pressure.
For what it’s worth (and they’re worth a lot, particularly to someone waiting for an ambulance) here’s the numbers. December’s figure highest since December 2022, but about half as bad.
More stable and comparable it may be, but there are also drawbacks to this measure. Specifically, it can be easily gamed by a Trust wanting to reduce their numbers. The end-to-end 12 hour wait measure is (probably) better still.
And to a lesser extent, RSV, though this tends to hit the youngest and puts strain on paediatric beds, while flu and COVID hits the oldest and puts strain on adult beds.
Because we’ve got the data, essentially. Flu pressure also peaked lower, and there are emerging signs here this is because the flu wave is more “spread out” than last year’s single massive spike. This is more in keeping with pre-pandemic times.

There's also a question as to whether we’re detecting as many COVID infections in hospital as we used to (and in particular when testing was mandatory for all admissions). I’ve written a lot as to why I don’t think it’s a big factor, and still think this - so I’m not going to revisit again.
The enormous 18-64 range is obviously not ideal. There are tighter age-bands, but they are released with an enormous lag, and haven’t been updated since early 2023.
You need incidence (i.e., how many new infections per day) to compare to daily admissions rates. But we don’t have incidence (yet), we have prevalence (how many infections there are in the population on any given day). UKHSA have promised that the incidence measure is coming, but not yet. One could compare prevalence to people in hospital (beds filled) but these aren’t split easily by age, and getting an IHR out of this depends on assumptions on how long people spend in hospital - e.g., long-haulers will be a problem.
“Peak to peak” is a way of getting around the difficult “lag” problem - when you should match a particular prevalence rate with a particular hospitalisation. Peaks act somewhat like the “clap boards” in filming, acting as a point to synchronise the sound and picture. Or in this case, the prevalence and hospitalisation.
“With”, not “for”. While the NHS does an estimate of how many people in hospital are there due to their COVID, rather than it being incidental to their main complain, they do not split it by age. I really wish they would.
Regarding 3), I think I know why.
If you look at anti nucleocapsid prevalence, the oldest age groups had a massive increase in 2023 compared to 2022. That might explain why the prevalence fell in the oldest age groups in 2023 / 2024 compared to 2022 / 2023.
Source: https://www.gov.uk/government/publications/covid-19-vaccine-weekly-surveillance-reports
Also, regarding 3), the youngest age groups were already saturated with anti nucleocapsid antibodies, but their vaccine protection faded away because vaccines are not offered to the younger age groups anymore. So that might explain why the prevalence in the youngest age groups increased in 2023 / 2024 compared to 2022 / 2023.
Source: https://www.gov.uk/government/publications/covid-19-vaccine-weekly-surveillance-reports